Current to Matt Benning.
| Rank | Team | PandaScore |
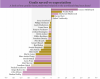
| 1 | Ottawa | 178.6 |
| 2 | Philadelphia | 173.7 |
| 3 | Dallas | 170.0 |
| 4 | Arizona | 170.5 |
| 5 | Washington | 168.9 |
| 6 | San Jose | 170.3 |
| 7 | Toronto | 170.1 |
| 8 | Calgary | 170.0 |
| 9 | Carolina | 169.4 |
| 10 | Minnesota | 168.5 |
| 11 | NY Islanders | 168.1 |
| 12 | Vancouver | 168.9 |
| 13 | St. Louis | 166.9 |
| 14 | Anaheim | 166.4 |
| 15 | Buffalo | 166.3 |
| 16 | Los Angeles | 165.7 |
| 17 | Tampa Bay | 166.2 |
| 18 | Detroit | 164.9 |
| 19 | Chicago | 164.5 |
| 20 | Colorado | 164.4 |
| 21 | Montreal | 164.1 |
| 22 | New Jersey | 163.7 |
| 23 | Pittsburgh | 163.3 |
| 24 | Edmonton | 162.7 |
| 25 | Florida | 158.9 |
| 26 | Nashville | 161.7 |
| 27 | Vegas | 159.9 |
| 28 | Boston | 159.8 |
| 29 | Columbus | 158.8 |
| 30 | Winnipeg | 156.1 |
| 31 | NY Rangers | 152.7 |
[TBODY]
[/TBODY]
As always, Panda Score works off of this year's data. Relevant statistics in scoring each player's performance over the past season include PPG over 82 games, GF%, DFF% * 0.462, DFF% rel * 0.462, CF% * 0.345, CF%rel * 0.345, TOI against elite, and PDO.
All (relevant) data prior to this season ignored. All indications of physicality, grit and toughness are ignored.