
Player Discussion Henrik Lundqvist: Part II
- Thread starter Fugazy
- Start date
You are using an out of date browser. It may not display this or other websites correctly.
You should upgrade or use an alternative browser.
You should upgrade or use an alternative browser.
- Status
- Not open for further replies.
HFBS
Noted Troublemaker
- Jan 18, 2015
- 2,134
- 2,108
As far as I'm concerned, Henrik is the best goalie the Rangers have ever had and the only Ranger goalie that I consider the best goalie of his time during my hockey watching career, and I go back to Giacomin. Even though his contract may hurt the team now I have no regrets. He's more than earned it.

True Blue
Registered User
How is this even a discussion?Even though his contract may hurt the team now I have no regrets. He's more than earned it.
Bleed Ranger Blue
Registered User
- Jul 18, 2006
- 19,799
- 1,811
As far as I'm concerned, Henrik is the best goalie the Rangers have ever had and the only Ranger goalie that I consider the best goalie of his time during my hockey watching career, and I go back to Giacomin. Even though his contract may hurt the team now I have no regrets. He's more than earned it.
How is his contract hurting the team? They're a helluva lot further then $8M away from competing, so we should all just be enjoying his ride into the sunset.
Hank has been good and has the right attitude. He’s always been a consummate professional and realistically, he’s been the franchise for 15 years. I’m more than fine with him sticking around.
NYRFANMANI
Department of Rempe Safety Management
UnSandvich
Registered User
- Sep 7, 2017
- 5,200
- 7,373
Blue Blooded
Most people rejected his message
I've seen a lot of talk about how our goalies aren't really doing a good enough job while citing their respective Sv%, which aren't exactly in the top of the league. I just wanted to show everyone what happens when you use xG as the basis for goalie performance rather than just counted shots and goals.
Here are the top 30 goalies with 300+ minutes (total sample: 57 goalies) in terms of goals saved above expectation per game (all situations):

*When Natural Stat Trick lists GSAA/60 they do so only in terms of regular save %, which isn't the way Corsica did it with xG. I have here recalculated it with xG instead.
As @Mac n Gs pointed out in some other thread, we are giving our goalies an insanely difficult task and they are doing a very good job with it.
This is the goaltending stat that has had Hank as the best goalie in the league pretty much every year between 2007-08 and 2015-16 and on aggregate has him so far ahead of his peers they might as well play different sports.
Another note is that we can clearly see how the increase in scoring isn't coming from a higher degree of dangerous shots, but what looks like a general increase in shooting percentage. The xG algorithm is trained on historical data, where scoring was lower. If the increase was merely teams generating more dangerous chances, the goalies would perform "average" according to GSAA but only 16/57 goalies have managed to do that so far this year (and we it last year as well). So Georgiev's +0.04 is actually +0.35 compared to the average GSAA/60 among these 57 goalies (-0.31) and Hank's +0.2 is more akin to a +0.55.
Here are the top 30 goalies with 300+ minutes (total sample: 57 goalies) in terms of goals saved above expectation per game (all situations):
*When Natural Stat Trick lists GSAA/60 they do so only in terms of regular save %, which isn't the way Corsica did it with xG. I have here recalculated it with xG instead.
As @Mac n Gs pointed out in some other thread, we are giving our goalies an insanely difficult task and they are doing a very good job with it.
This is the goaltending stat that has had Hank as the best goalie in the league pretty much every year between 2007-08 and 2015-16 and on aggregate has him so far ahead of his peers they might as well play different sports.
Another note is that we can clearly see how the increase in scoring isn't coming from a higher degree of dangerous shots, but what looks like a general increase in shooting percentage. The xG algorithm is trained on historical data, where scoring was lower. If the increase was merely teams generating more dangerous chances, the goalies would perform "average" according to GSAA but only 16/57 goalies have managed to do that so far this year (and we it last year as well). So Georgiev's +0.04 is actually +0.35 compared to the average GSAA/60 among these 57 goalies (-0.31) and Hank's +0.2 is more akin to a +0.55.
The King now sits alone in 5th all time for wins on 455.
He turns 38 before the season ends, and has one more year on his current contract while needing 30 more wins to pass Belfour for 4th and 36 to pass Luongo.
Very unlikely he can get to Roy's 551, but I'm assuming the general consensus is that he'll retire 3rd all time?
He turns 38 before the season ends, and has one more year on his current contract while needing 30 more wins to pass Belfour for 4th and 36 to pass Luongo.
Very unlikely he can get to Roy's 551, but I'm assuming the general consensus is that he'll retire 3rd all time?
haohmaru
boomshakalaka
Fleury isn’t far behind and playing on a better team. Unfortunately, I think he’ll retire with more W’s than Henrik.
Fleury isn’t far behind and playing on a better team. Unfortunately, I think he’ll retire with more W’s than Henrik.
Very likely. Imagine having Crosby and Malkin on your team for the better part of your career.
SingnBluesOnBroadway
Retired
Last edited:
Chelis Chili
Proud HFB member since 21 years [sic!]
LUNDQVIST PASSES JOSEPH FOR FIFTH PLACE ON ALL-TIME WINS LIST
Rangers goaltender Henrik Lundqvist made 26 saves to earn his 455th career regular-season win and pass Curtis Joseph (454) for sole possession of fifth place on the NHL’s all-time list.
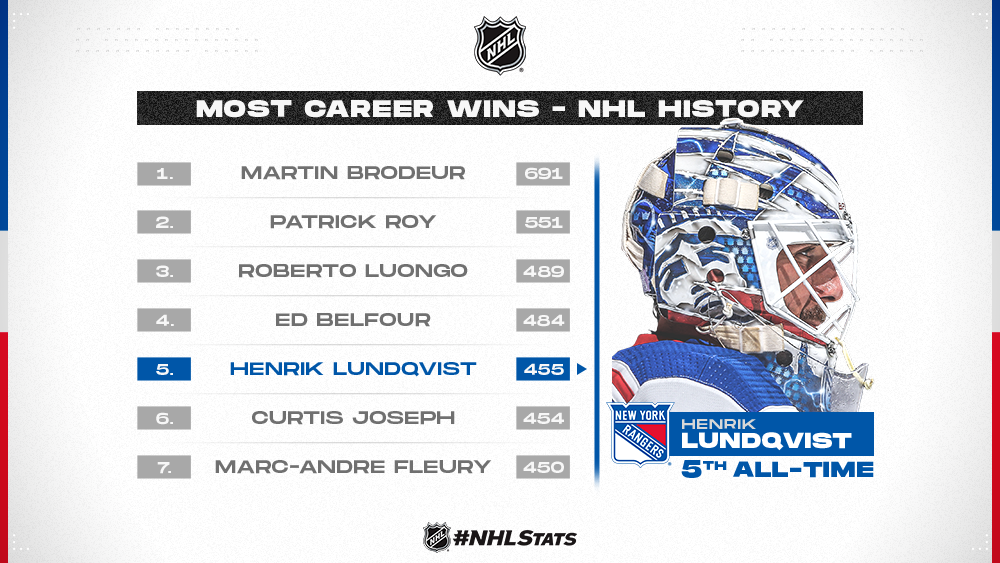
* Lundqvist appeared in his 871st career regular-season game – the 10th-highest total by a goaltender in NHL history and the sixth-most by any player in Rangers annals behind Harry Howell (1,160), Brian Leetch (1,129), Rod Gilbert (1,065), Ron Greschner (981) and Walt Tkaczuk (945).
* Of the four goaltenders ahead of Lundqvist on the all-time wins list, only two had more victories through their 871st career regular-season game: Martin Brodeur (483) and Patrick Roy (464). Roberto Luongo owned 404 regular-season wins through his 871st career appearance, while Ed Belfour had 443.
Rangers goaltender Henrik Lundqvist made 26 saves to earn his 455th career regular-season win and pass Curtis Joseph (454) for sole possession of fifth place on the NHL’s all-time list.
* Lundqvist appeared in his 871st career regular-season game – the 10th-highest total by a goaltender in NHL history and the sixth-most by any player in Rangers annals behind Harry Howell (1,160), Brian Leetch (1,129), Rod Gilbert (1,065), Ron Greschner (981) and Walt Tkaczuk (945).
* Of the four goaltenders ahead of Lundqvist on the all-time wins list, only two had more victories through their 871st career regular-season game: Martin Brodeur (483) and Patrick Roy (464). Roberto Luongo owned 404 regular-season wins through his 871st career appearance, while Ed Belfour had 443.
Edge
Kris King's Ghost
Fleury isn’t far behind and playing on a better team. Unfortunately, I think he’ll retire with more W’s than Henrik.
Unfortunately, that's the downside of goalie milestones --- they can be very dependent on things that are out of a goalie's control.
In Fleury's case, he went from a stacked Pittsburgh team to a stacked Las Vegas team. There's not a huge sample size of what he'd look like playing on a poor team.
In Lundqvist's case, his decision to remain with the Rangers will probably end up costing him quite a few wins. He never enjoyed a scenario where the team around him made up the difference when he was no longer at his very best. If he does to a top team, that doesn't require him to have to be Superman, he's probably doing just fine.
At the end of the day, the top three goalies in wins will all be French-Canadian guys. And it will happen not because there's some kind of secret sauce, but because their careers happen happened to follow a most fortuitous path --- either be design, or simply by good fortune.
Brooklyn Rangers Fan
Change is good.
Depending on how you define "top three". But, yes.Unfortunately, that's the downside of goalie milestones --- they can be very dependent on things that are out of a goalie's control.
In Fleury's case, he went from a stacked Pittsburgh team to a stacked Las Vegas team. There's not a huge sample size of what he'd look like playing on a poor team.
In Lundqvist's case, his decision to remain with the Rangers will probably end up costing him quite a few wins. He never enjoyed a scenario where the team around him made up the difference when he was no longer at his very best. If he does to a top team, that doesn't require him to have to be Superman, he's probably doing just fine.
At the end of the day, the top three goalies in wins will all be French-Canadian guys. And it will happen not because there's some kind of secret sauce, but because their careers happen happened to follow a most fortuitous path --- either be design, or simply by good fortune.
haohmaru
boomshakalaka
The Lundqvist is Done crowd being awfully quiet lately...
- Jul 6, 2017
- 13,025
- 11,968
The most overrated goalie of the generation to boot ...Fleury isn’t far behind and playing on a better team. Unfortunately, I think he’ll retire with more W’s than Henrik.
- Jul 6, 2017
- 13,025
- 11,968
He still has it. The stamina just isn’t there anymore. But what can one expect? It’s natural.The Lundqvist is Done crowd being awfully quiet lately...
Unfortunately, that's the downside of goalie milestones --- they can be very dependent on things that are out of a goalie's control.
In Fleury's case, he went from a stacked Pittsburgh team to a stacked Las Vegas team. There's not a huge sample size of what he'd look like playing on a poor team.
In Lundqvist's case, his decision to remain with the Rangers will probably end up costing him quite a few wins. He never enjoyed a scenario where the team around him made up the difference when he was no longer at his very best. If he does to a top team, that doesn't require him to have to be Superman, he's probably doing just fine.
At the end of the day, the top three goalies in wins will all be French-Canadian guys. And it will happen not because there's some kind of secret sauce, but because their careers happen happened to follow a most fortuitous path --- either be design, or simply by good fortune.
MAF also had like a 3 year head start in the NHL.
GoAwayGiannone
Registered User
In honor of his 1000th game, let me post the funniest interview I've ever seen in pro sports. Major props to Hank here for holding his composure.
Chaels Arms
Formerly Lias Andersson
Fischler was an absolute mess. Guy predicted the Rangers going to the Finals every single season.
Fischler was an absolute mess. Guy predicted the Rangers going to the Finals every single season.
Lmao too true.
The team the year of that interview was probably my 3rd least favorite iteration of the Rangers behind the 09-10 team and last year's team.
Harbour Dog
Registered User
The most overrated goalie of the generation to boot ...
Somewhere, Carey Price just did a Tim Horton's coffee spit take all over the dashboard of his fully loaded F-150.
Leetch3
Registered User
- Jul 14, 2009
- 12,952
- 10,732
i love the idea of a post hank tandem of georgiev & shesty but hank doesn't look like a guy that is ready to retire anytime soon...honestly would it surprise anyone to see hank sign another contract after the current one and finish his career as a tandem and eventually backup for 1 of those 2?
Ail
Based and Rangerspilled.
I want Henrik to play here as long as possible. Would hate to see MAF end up higher in wins because of the teams he played for. Lundqvist is the best goalie since he came in the league by far but has always been overshadowed by flashes in the pan who were never nearly as consistent.
Also LMAO Carey Price, I will never understand the media obsession with this guy.
Also LMAO Carey Price, I will never understand the media obsession with this guy.
- Status
- Not open for further replies.