Blue Bullet Report(Updated Apr 22: Expected Draft Value of a Forward Selected Top 90)

Blue Bullet

Registered User
Feb 27, 2002
998
0
Bon Accord, AB
Visit site
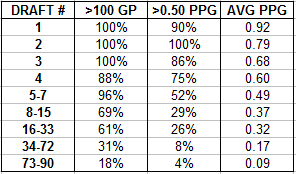
In my latest post at the bluebulletreport.com, I look at the correlation between draft position and career average points per game, as well as the correlation between draft position and career average time on ice, for first round selections. Based on this, one is able to see how accurate teams are at selecting forwards and defenseman. Ideally, the top picks would play the most minutes and produce the most points. In the end, the strongest correlation turns out to be between draft position and career average time on ice for defenseman.

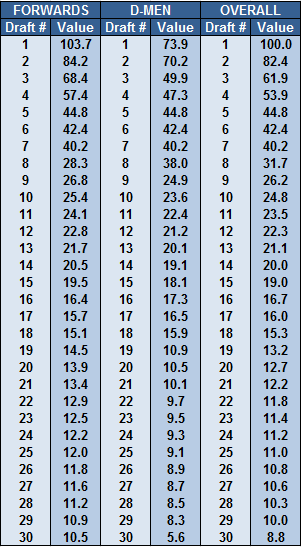
Therefore, d-men are not a bigger gamble than forwards when it comes to reaching their potential. While d-men do take longer to develop than forwards and that should be held in consideration when selecting a d-man, for those teams with patience and the ability to retain the talent they drafted, they should have no concerns over taking a d-man in the first round over a forward.
 

Mc5RingsAndABeer

5-14-6-1
May 25, 2011
20,184
1,385
Awesome post. I think the notion of forwards being a more sure bet is at the very top of the draft (top5), but the sample sizes are probably too small to draw any meaningful conclusions.
 

Aceboogie

Registered User
Aug 25, 2012
32,649
3,896
In some future posts I will be breaking down the draft into different groups based on odds of success. I will than apply to 2016.

One player the model is not fond of is Max Jones. No player drafted between 98 and 2010 in the first round with his stats went on to have a career average of 0.5+ PPG. He is almost a sure bet to be a bottom six player.

I fully agree, he seems like a land mine waiting to happen. Bellows seems like another Nylander to me, high skilled forward
 

Blue Bullet

Registered User
Feb 27, 2002
998
0
Bon Accord, AB
Visit site
Awesome post. I think the notion of forwards being a more sure bet is at the very top of the draft (top5), but the sample sizes are probably too small to draw any meaningful conclusions.

I would agree that forwards are the safer bet. Over the next few weeks I will be posting odds on likelihood of success based on statistical comparables. For 2016, the odds are better if you take one of the top 6 forwards (Matthews, the 2 Finns, Tkachuk, Dubois and Nylander) over any of the defenseman available.
 

Blue Bullet

Registered User
Feb 27, 2002
998
0
Bon Accord, AB
Visit site
In my latest post at the bluebulletreport.com, I look at the expected draft value of first round defenseman by using games played and career ATOI. Through my analysis, I have determined that the expected draft value, for a first round defenseman, can be separated into 5 different groupings. Those groups are:

1) Top 2 overall
2) 3-8 overall
3) 9-18 overall
4) 19-29 overall
5) 30th overall

Therefore, to read a more in depth look at how these numbers came about and what the likelihood of a player in each group reaching the thresholds of at least 100 games played and a career ATOI of 18:30 minutes/game, click here.
 

Blue Bullet

Registered User
Feb 27, 2002
998
0
Bon Accord, AB
Visit site
In my latest post at the bluebulletreport.com, I continue my look at the expected draft value of a defenseman. In my previous post I determined that the expected draft value, for a first round defenseman, can be separated into 5 different groupings. This was based on likelihood to reach at least 100 NHL games played and the likelihood to reach at least 100 NHL games played while maintaining a career ATOI of 18:30 minutes/game or better. The groups are:

summarytop30d1.png


I continue on with my analysis by looking at the expected draft value of a second and third round defenseman. The groups for them are:

5) 30-50 overall
6) 51-75 overall
7) 76-90 overall

Therefore, to read a more in depth look at how these numbers came about and the likelihood of each group at reaching the thresholds of at least 100 games played and a career ATOI of 18:30 minutes/game, click here.
 

Blue Bullet

Registered User
Feb 27, 2002
998
0
Bon Accord, AB
Visit site
In previous posts at the bluebulletreport.com, I looked at the expected draft value of a defenseman selected in the top 90 overall in the NHL Entry Draft. I determined that the expected draft value can be separated into 7 different groupings. This was based on likelihood to reach at least 100 NHL games played and the likelihood to reach at least 100 NHL games played while maintaining a career ATOI of 18:30 minutes/game or better. The groups are:

dmengroups.png


Combining this research with the fantastic research done by Rhys Jessop, we find that the improvement in odds of success are staggering for those defenseman that reach a certain PPG threshold. Rhys Jessop uses 0.55 PPG and I use an adjusted PPG of 0.44. My adjusted PPG values PP scoring at a lower rate than ES and SH scoring.

Take a look and see how taking a defenseman that shows offensive promise in junior has a significantly better chance at becoming a quality player.

Click Here to read the post
 

Blue Bullet

Registered User
Feb 27, 2002
998
0
Bon Accord, AB
Visit site
In my last post at the bluebulletreport.com I looked at how CHL defenseman who have an adjusted PPG of 0.44 or better are much more likely to become NHL defenseman in terms of games played. They are also much more likely to be quality NHL defenseman with a higher ATOI through their career.

The results for CHL defenseman drafted in the top 90 between 1998 and 2010 are:

chlodds1.png


Therefore, I wanted to know what group does each CHL defenseman drafted in the top 90, between 2011 to 2015, fall into? In addition, which of these defensemen have already reached some or all of the three thresholds? And if a few defenseman have reached some of the thresholds, than the odds for the remaining defensemen would decrease. Therefore, what are the odds for the defensemen that have not yet reached some or all of the three thresholds?

To find answer to these questions click here to read.
 

Panda Bear

Registered User
Apr 2, 2010
6,578
5,718
In my last post at the bluebulletreport.com I looked at how CHL defenseman who have an adjusted PPG of 0.44 or better are much more likely to become NHL defenseman in terms of games played. They are also much more likely to be quality NHL defenseman with a higher ATOI through their career.

The results for CHL defenseman drafted in the top 90 between 1998 and 2010 are:

chlodds1.png


Therefore, I wanted to know what group does each CHL defenseman drafted in the top 90, between 2011 to 2015, fall into? In addition, which of these defensemen have already reached some or all of the three thresholds? And if a few defenseman have reached some of the thresholds, than the odds for the remaining defensemen would decrease. Therefore, what are the odds for the defensemen that have not yet reached some or all of the three thresholds?

To find answer to these questions click here to read.
If you're using draft year adjusted PPG as a benchmark for success, how come the adjusted PPG for each player doesn't change their individual chance of success?

If you qualify the group accordingly, shouldn't you also qualify the individual? It's a bit bland seeing every player in a group defined by adjusted PPGs get a 27% or 46% when they have slightly different individual adjusted PPGs.
 

Blue Bullet

Registered User
Feb 27, 2002
998
0
Bon Accord, AB
Visit site
When I discover there being a difference between an adjusted PPG of 0.5 and 0.7, for example, I will add that into the mix. For the time being I have found nothing yet to suggest that it makes a difference. The measurement more works as a pass/fail. Think of it as defenceman with a 0.44+ adjusted PPG is much more likely to have the puck skills needed in a NHL dman. Therefore, there is nothing at this time to differentiate an individual if they wall within the same range of draft position and the same range of adjusted PPG.

When I do the 2016 rankings I can differentiate due to the fact players will fall into varying groups based on where each scouting service ranks that player.
 

Blue Bullet

Registered User
Feb 27, 2002
998
0
Bon Accord, AB
Visit site
In my latest post at the bluebulletreport.com I delve into the expected draft value of a forward selected in the top 90 overall. For the study, I look at forwards drafted between 1998 and 2010 and their likelihood of reaching 100 NHL games played and their likelihood of reaching 100 NHL games played while having a career average PPG of 0.50 or better.

These are the results of the study:

summaryexpectedvalueforwards.png


To read the full post and how these results came about, click here.
 

Blue Bullet

Registered User
Feb 27, 2002
998
0
Bon Accord, AB
Visit site
In my latest post at the bluebulletreport.com I delve into the expected draft value of a CHL forward selected in the top 90 overall. I have grouped the forwards based on both a statistical measurement called NHLP (my point prediction model for a CHL forwards best season in the NHL) and by draft selection. I than calculate the % of forwards that have played 100 NHL games and the average PPG of those forwards that do end up playing 100+ games.

These are the results:

expectedvaluetop90chl.png


To compare, these are the results for the expected value of all forwards in the top 90 (not just CHL).

expecteddraftvaluetop90f.png


To read the full post and how these results came about and how to utilize them best, click here.
 
Last edited:

Blue Bullet

Registered User
Feb 27, 2002
998
0
Bon Accord, AB
Visit site
In my latest post at the bluebulletreport.com I breakdown the expected draft value of forwards selected in the top 90 overall by region (CHL vs Euro vs rest of N.A.).

Previously, I did work on the expected draft value of all forwards selected in the top 90 overall. Through this research I determined that the forwards in the top 90 can be divided into 9 groups based on draft position. I than calculate the % of forwards that have played 100 NHL games from each group and the average PPG of those forwards that do end up playing 100+ games. The results are:

summaryexpectedvalueforwards.png


Therefore, with everything else being equal, which region provides the best bet for the team drafting?

If in the top 4, head to Europe young man.

Between 5th and 33rd, USA all the way.

And for 34th to 90th, the CHL is the way to go.

To read more, click here.
 

Blue Bullet

Registered User
Feb 27, 2002
998
0
Bon Accord, AB
Visit site
It is popular these days to do a value chart for draft selections. Recently on TSN, Travis Yost did one based on adjusted games played which is a good starting point. However, it misses the fact that games played only measure the quantity not the quality of games played. For those following along to my blog, you will know that most of my research has been in trying to group forwards and defenseman based on quality of play using career avg PPG for forwards and career ATOI for defensemen. Combining my work with the fantastic work done by Michael Schuckers I was able to come up with a value chart for first year eligible forwards and defenseman. These are the results:

round1valuepickchart.png


round2valuepickchart.png


round3valuepickchart.png


I also look into some trade scenarios for the 2016 draft using my draft pick value chart. For example, if the Leafs traded down to 2nd overall Yost suggests all the Jets need to add is the 96th overall pick. My chart suggests otherwise.

trade1.png


To read more, CLICK HERE
 

Jimmi McJenkins

Sometimes miracles
Jan 12, 2006
75,606
35,392
Alberta
It is popular these days to do a value chart for draft selections. Recently on TSN, Travis Yost did one based on adjusted games played which is a good starting point. However, it misses the fact that games played only measure the quantity not the quality of games played. For those following along to my blog, you will know that most of my research has been in trying to group forwards and defenseman based on quality of play using career avg PPG for forwards and career ATOI for defensemen. Combining my work with the fantastic work done by Michael Schuckers I was able to come up with a value chart for first year eligible forwards and defenseman. These are the results:

round1valuepickchart.png


round2valuepickchart.png


round3valuepickchart.png


I also look into some trade scenarios for the 2016 draft using my draft pick value chart. For example, if the Leafs traded down to 2nd overall Yost suggests all the Jets need to add is the 96th overall pick. My chart suggests otherwise.

trade1.png


To read more, CLICK HERE

Terrific work and great breakdown
 

Jephman

Registered User
Jun 1, 2010
258
7
Do you have any theories on why the 34th and 73rd picks experience such a huge drop off?

My only thought on the 34th is that there could be a few guys who found themselves dropping out of the first round because they are seen as too risky. Teams who have those first 3 picks in the second generally picked 1-2-3 in the first round, so they figure they've walked away with a solid NHLer and can justify swinging for the fences with their second pick by selecting one of those boom/bust players.
 

Ad

Upcoming events

Ad

Ad