
TheOtherOne
Registered User
- Jan 2, 2010
- 8,276
- 5,273
As a fan of the worst team in the league by far I have to give myself reason for hope any way I can. So I have to hope we can compete in 3 years (3 is an arbitrary number, this exercise could of course be done differently). Therefore I wanted to look at where Stanley Cup winners and runner-ups were 3 years prior to their success. I hope you find my results interesting.
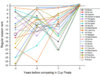
3 years before competing in the Cup finals, the...
- Blues and Bruins were #3 and #16
- Capitals and Golden Knights were #9 and nonexistent
- Penguins and Predators were #6 and #19
- Penguins and Sharks were #2 and #11
- Blackhawks and Lightning were #10 and #21
- Kings and Rangers were #12 and #18
- Blackhawks and Bruins were #3 and #14
- Kings and Devils were #26 and #5
- Bruins and Canucks were #15 and #21
- Blackhawks and Flyers were #26 and #30
- Penguins and Red Wings were #29 and #1
The number shown is the league regular season standings. This should give you an idea of how far a team has historically been able to rise within 3 years. The average is #14. This means a bubble team is likely to compete for the Cup in 3 years, but there is also a lot of variance so don't read too much into that.
The winner is listed first. One may also find it interesting that the team that was ranked higher 3 years prior almost always won in the Finals (Kings and Penguins are the 2 exceptions out of 11 cases).
A top-third / middle-third / bottom-third team has a
62/29/10 % chance of playing in the Finals next year,
67/29/5 % chance of playing in the Finals in two years,
38/33/29 % chance of playing in the Finals in three years.
About the chart:
For years -3, -2, -1, the number on the vertical axis indicates the standings position, 1-30 (ignore the negative sign).
For year 0, the number on the vertical axis is 1 for the Stanley Cup winner and 0 for the Stanley Cup runner-up.
Attachments
Last edited:


