No worries. I'll do a fake example with numbers that are easy for me to work with hahah.
Example:
Player Bob enters a league with a 10% shooting percentage.
Player Bob scores with a 20% shooting percentage with 100 shots.
Odds are Bob is probably a better finisher than the average player (although there is still a chance he is actually worse than average).
Odds are also that Bob is not that extremely better than average (although there is still a chance he is).
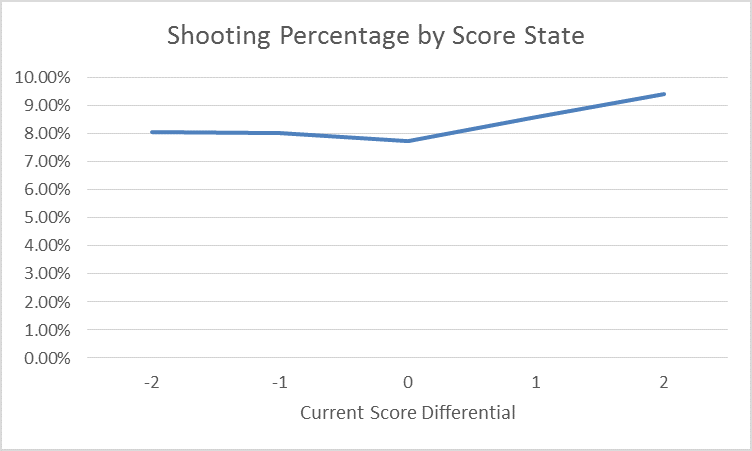
The most likely truth is Bob is somewhere in between 10 and 20. Regressed shooting is just a methodology to best estimate future performance knowing that extremes are unlikely and most as samples expand the outcomes tend to regress towards a mean (ex:
graph).
Here's two ways you can regress shooting percentage for Bob...
Method One:
Let's say history shows us that we should regress to 80% of the mean at 100 shots. That means the most likely (but not only) true talent value for Bob is 12%.
(Maths: 10 is average. Bob is 20. Difference between two is +10. 20% of +10 is +2. 10+2=12.)
The issue with this method is you'd have to know the amount to regress by at each sample size.
Method Two
Another way to do it is just assuming league average for remainder of shots. Let's say we know that 500 shots are what we need for 95% confidence. We would then assume a 12% shooting percentage (this number being the same is actually accidental... I'm making this example up as I go).
(Maths: 20% sh% on 100 shots = 20 goals. 10% on 400 shots is 40 goals. That's 60 goals in 500 shots, or 12% sh%.)
Hope this is helpful.
")
EDIT:
As an aside, there is one problem I have with this video, which I brought up to Mike Kelly and he didn't get it.
"Luck" and unsustainability doesn't just mean random bounces.
Players garnering more high quality chances per shot one season than previous doesn't mean he necessarily will again.
(That and I hate the binning continuous variables with things like shot quality)


 :
: