NHL Team Power Ratings 2016-17 (SRS Algorithm)

morehockeystats

Unusual hockey stats
Dec 13, 2016
617
296
Columbus
morehockeystats.com
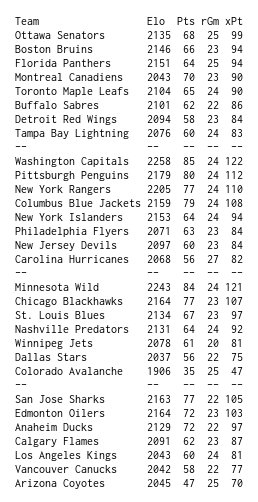
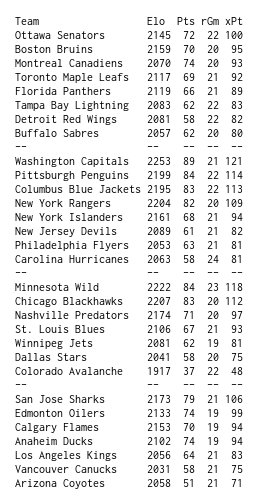
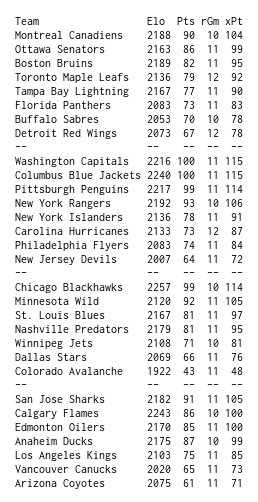
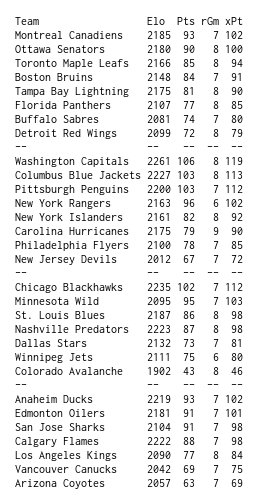
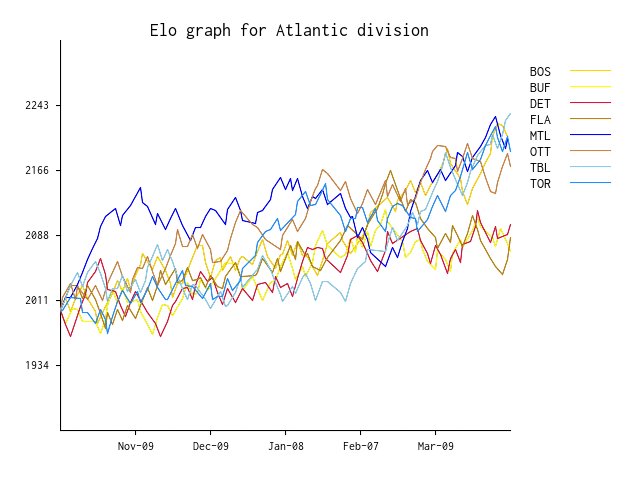
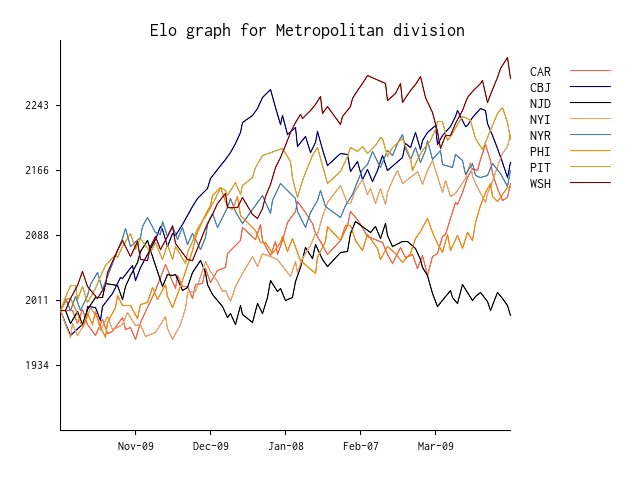
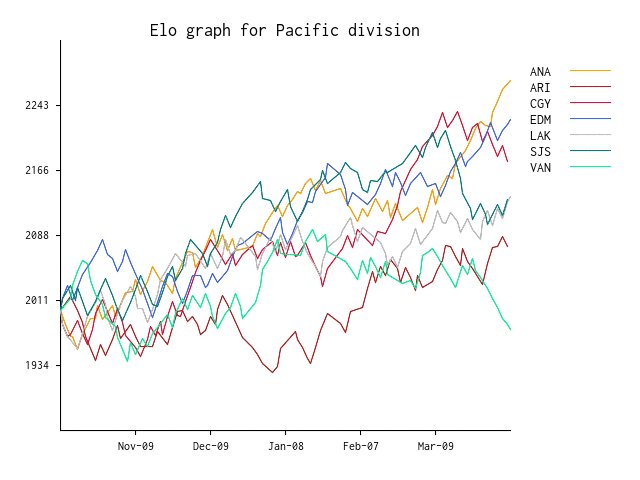
Elo projections for playoffs:
Full stats - http://morehockeystats.com/teams/elo
C5JAZIaUoAAu7ka.jpg

MTL, TOR, LAK all out for now.

There might some serious manipulation between CBJ and NYR to choose whether they want to play PIT or ATL#1
 

Doctor No

Registered User
Oct 26, 2005
9,250
3,971
hockeygoalies.org
SRS rankings, NHL games through February 26:

Team | 2016-17 Goal Diff | 2016-17 Schedule | 2016-17 Strength | Last Week
Washington|
1.148​
|
0.001​
|
1.149​
|
1​
|
Columbus|
0.900​
|
0.036​
|
0.936​
|
3​
|
Minnesota|
1.017​
|
-0.106​
|
0.911​
|
2​
|
Pittsburgh|
0.717​
|
0.043​
|
0.760​
|
5​
|
NY Rangers|
0.677​
|
0.000​
|
0.677​
|
4​
|
Chicago|
0.452​
|
-0.079​
|
0.373​
|
8​
|
San Jose|
0.410​
|
-0.053​
|
0.357​
|
6​
|
Edmonton|
0.238​
|
0.008​
|
0.246​
|
7​
|
Montreal|
0.194​
|
0.032​
|
0.225​
|
9​
|
Boston|
0.113​
|
0.043​
|
0.156​
|
12​
|
Toronto|
0.115​
|
-0.010​
|
0.105​
|
10​
|
Nashville|
0.161​
|
-0.065​
|
0.096​
|
15​
|
Ottawa|
0.050​
|
0.023​
|
0.073​
|
11​
|
NY Islanders|
-0.033​
|
0.084​
|
0.051​
|
13​
|
St. Louis|
-0.082​
|
0.089​
|
0.007​
|
14​
|
Anaheim|
0.016​
|
-0.038​
|
-0.023​
|
16​
|
Los Angeles|
-0.016​
|
-0.023​
|
-0.039​
|
17​
|
Tampa Bay|
-0.067​
|
0.003​
|
-0.063​
|
18​
|
Calgary|
-0.127​
|
-0.034​
|
-0.161​
|
22​
|
Winnipeg|
-0.238​
|
-0.021​
|
-0.259​
|
20​
|
Carolina|
-0.379​
|
0.116​
|
-0.263​
|
21​
|
Florida|
-0.279​
|
0.003​
|
-0.275​
|
19​
|
Buffalo|
-0.387​
|
0.016​
|
-0.371​
|
23​
|
Detroit|
-0.467​
|
0.094​
|
-0.372​
|
24​
|
Philadelphia|
-0.492​
|
0.040​
|
-0.451​
|
25​
|
Dallas|
-0.452​
|
-0.012​
|
-0.463​
|
27​
|
New Jersey|
-0.557​
|
0.086​
|
-0.472​
|
26​
|
Vancouver|
-0.541​
|
-0.038​
|
-0.579​
|
28​
|
Arizona|
-0.787​
|
0.029​
|
-0.758​
|
29​
|
Colorado|
-1.300​
|
0.050​
|
-1.250​
|
30​
|

Home-ice advantage is now estimated a nice round +0.300 goals/game.

On the bright side, the Avs finally won a game where I was in attendance! :handclap:
 

MNNumbers

HFBoards Sponsor
Sponsor
Nov 17, 2011
7,658
2,536
Sun Mar 5 Bradley-Terry Full Season Power Rankings Update.
Again – these ranking take into consideration who has played who, and are a mathematical representation of how good a season each team is having so far. These rankings do NOT consider who played who WHEN. Only, who played who and how many times.
The odds of Team 1 beating Team 2 are: PWRRNK(1)/(PWRRNK(1) + PWRRNK(2))

Metro:
Wash 192.8
CBJ 158.4
Pitt 156.5
NYR 133.8
NYI 99.4
Phil 87.4
Car 81.0
NJD 75.9

Atl:
Mtl 121.2
Ott 113.4
Bos 99.5
TBL 91.2
Flo 87.3
Tor 86.7
Buf 77.2
Det 77.0

Cent:
Minn 159.6
Chi 143.2
Nash 92.8
StL 92.2
Wpg 73.5
Dal 68.9
Col 33.1

Pac:
SJS 127.8
Edm 109.6
Ana 99.9
Cgy 97.6
LAK 82.0
Van 70.2
Arz 55.0
 

Doctor No

Registered User
Oct 26, 2005
9,250
3,971
hockeygoalies.org
NHL SRS power ratings, games through March 5, 2017:

Team | 2016-17 Goal Diff | 2016-17 Schedule | 2016-17 Strength | Last Week
Washington|
1.172​
|
-0.010​
|
1.162​
|
1​
|
Minnesota|
1.000​
|
-0.078​
|
0.922​
|
3​
|
Columbus|
0.875​
|
0.042​
|
0.917​
|
2​
|
Pittsburgh|
0.672​
|
0.028​
|
0.700​
|
4​
|
NY Rangers|
0.569​
|
0.020​
|
0.589​
|
5​
|
Chicago|
0.523​
|
-0.062​
|
0.461​
|
6​
|
San Jose|
0.422​
|
-0.045​
|
0.377​
|
7​
|
Montreal|
0.273​
|
0.038​
|
0.310​
|
9​
|
Edmonton|
0.262​
|
0.007​
|
0.269​
|
8​
|
Boston|
0.154​
|
0.020​
|
0.174​
|
10​
|
Nashville|
0.123​
|
-0.053​
|
0.070​
|
12​
|
Ottawa|
0.016​
|
0.009​
|
0.025​
|
13​
|
Toronto|
0.016​
|
0.004​
|
0.019​
|
11​
|
NY Islanders|
-0.078​
|
0.082​
|
0.004​
|
14​
|
Anaheim|
0.046​
|
-0.051​
|
-0.005​
|
16​
|
Tampa Bay|
-0.016​
|
0.002​
|
-0.014​
|
18​
|
St. Louis|
-0.094​
|
0.078​
|
-0.016​
|
15​
|
Los Angeles|
-0.046​
|
-0.015​
|
-0.061​
|
17​
|
Calgary|
-0.045​
|
-0.045​
|
-0.090​
|
19​
|
Winnipeg|
-0.121​
|
-0.033​
|
-0.155​
|
20​
|
Florida|
-0.281​
|
-0.018​
|
-0.299​
|
22​
|
Carolina|
-0.403​
|
0.086​
|
-0.318​
|
21​
|
Buffalo|
-0.364​
|
0.007​
|
-0.356​
|
23​
|
Detroit|
-0.460​
|
0.093​
|
-0.367​
|
24​
|
Philadelphia|
-0.406​
|
0.025​
|
-0.381​
|
25​
|
Dallas|
-0.415​
|
-0.006​
|
-0.421​
|
26​
|
New Jersey|
-0.615​
|
0.117​
|
-0.498​
|
27​
|
Vancouver|
-0.523​
|
-0.033​
|
-0.556​
|
28​
|
Arizona|
-0.815​
|
0.031​
|
-0.785​
|
29​
|
Colorado|
-1.422​
|
0.054​
|
-1.368​
|
30​
|

Home-ice advantage currently estimated at +0.316 goals/game.

Go Avs. :rant:
 

morehockeystats

Unusual hockey stats
Dec 13, 2016
617
296
Columbus
morehockeystats.com
Also, Buchholz and Sonneborn-Berger coefficient as well as Buchholz-based remaining strength description:
/More about these metrics in my blog posts:
Buchholz: http://morehockeystats.blogspot.com/2017/03/on-buchholz-and-sonneborn-berger.html
Sonneborn-Berger: http://morehockeystats.blogspot.com/2017/03/on-buchholz-and-sonneborn-berger_13.html


+-----+-------+-------+-------+-------+
| TEM | Ptd/G | Buchz | So-Be | ReStr |
+-----+-------+-------+-------+-------+
| ANA | 1.208 | 1.103 | 0.648 | 1.139 |
| ARI | 0.859 | 1.122 | 0.467 | 1.141 |
| BOS | 1.155 | 1.114 | 0.610 | 1.155 |
| BUF | 0.972 | 1.128 | 0.550 | 1.151 |
| CAR | 1.043 | 1.138 | 0.588 | 1.117 |
| CBJ | 1.408 | 1.116 | 0.778 | 1.175 |
| CGY | 1.194 | 1.100 | 0.640 | 1.139 |
| CHI | 1.375 | 1.087 | 0.730 | 1.079 |
| COL | 0.606 | 1.122 | 0.336 | 1.211 |
| DAL | 0.930 | 1.120 | 0.497 | 1.089 |
| DET | 0.957 | 1.133 | 0.536 | 1.123 |
| EDM | 1.197 | 1.118 | 0.643 | 1.017 |
| FLA | 1.028 | 1.125 | 0.555 | 1.141 |
| LAK | 1.056 | 1.112 | 0.582 | 1.147 |
| MIN | 1.296 | 1.103 | 0.711 | 1.006 |
| MTL | 1.250 | 1.127 | 0.679 | 1.030 |
| NJD | 0.901 | 1.154 | 0.494 | 1.092 |
| NSH | 1.141 | 1.104 | 0.617 | 1.106 |
| NYI | 1.099 | 1.140 | 0.613 | 1.109 |
| NYR | 1.292 | 1.121 | 0.706 | 1.200 |
| OTT | 1.211 | 1.114 | 0.663 | 1.144 |
| PHI | 1.042 | 1.126 | 0.568 | 1.176 |
| PIT | 1.394 | 1.112 | 0.758 | 1.160 |
| SJS | 1.282 | 1.106 | 0.689 | 1.109 |
| STL | 1.141 | 1.138 | 0.635 | 0.895 |
| TBL | 1.085 | 1.128 | 0.593 | 1.090 |
| TOR | 1.129 | 1.113 | 0.610 | 1.153 |
| VAN | 0.915 | 1.116 | 0.483 | 1.171 |
| WPG | 0.986 | 1.110 | 0.521 | 1.123 |
| WSH | 1.408 | 1.123 | 0.775 | 1.112 |
+-----+-------+-------+-------+-------+
 

Doctor No

Registered User
Oct 26, 2005
9,250
3,971
hockeygoalies.org
Here's the final regular season numbers for 2016-17:

Team | 2016-17 Goal Diff | 2016-17 Schedule | 2016-17 Strength | Last Week
Washington|
0.988​
|
0.008​
|
0.996​
|
1​
|
Columbus|
0.659​
|
0.032​
|
0.691​
|
2​
|
Minnesota|
0.707​
|
-0.064​
|
0.643​
|
3​
|
Pittsburgh|
0.585​
|
0.017​
|
0.602​
|
4​
|
NY Rangers|
0.439​
|
0.040​
|
0.479​
|
5​
|
Edmonton|
0.427​
|
-0.046​
|
0.381​
|
7​
|
Chicago|
0.378​
|
-0.049​
|
0.329​
|
6​
|
Montreal|
0.317​
|
0.002​
|
0.319​
|
8​
|
Boston|
0.268​
|
0.007​
|
0.275​
|
9​
|
Anaheim|
0.280​
|
-0.029​
|
0.252​
|
12​
|
San Jose|
0.244​
|
-0.020​
|
0.224​
|
10​
|
St. Louis|
0.207​
|
-0.026​
|
0.181​
|
11​
|
Nashville|
0.195​
|
-0.030​
|
0.166​
|
13​
|
Toronto|
0.110​
|
0.009​
|
0.119​
|
14​
|
Tampa Bay|
0.085​
|
0.016​
|
0.102​
|
15​
|
NY Islanders|
-0.012​
|
0.056​
|
0.043​
|
18​
|
Calgary|
0.061​
|
-0.029​
|
0.032​
|
16​
|
Ottawa|
-0.024​
|
0.022​
|
-0.002​
|
17​
|
Los Angeles|
-0.049​
|
-0.010​
|
-0.059​
|
19​
|
Winnipeg|
-0.085​
|
-0.016​
|
-0.102​
|
22​
|
Philadelphia|
-0.207​
|
0.045​
|
-0.162​
|
21​
|
Carolina|
-0.256​
|
0.056​
|
-0.200​
|
20​
|
Florida|
-0.329​
|
0.042​
|
-0.288​
|
23​
|
Buffalo|
-0.439​
|
0.044​
|
-0.395​
|
24​
|
Detroit|
-0.451​
|
0.048​
|
-0.404​
|
25​
|
Dallas|
-0.476​
|
0.006​
|
-0.470​
|
26​
|
New Jersey|
-0.744​
|
0.086​
|
-0.658​
|
27​
|
Vancouver|
-0.744​
|
0.022​
|
-0.722​
|
28​
|
Arizona|
-0.768​
|
0.020​
|
-0.748​
|
29​
|
Colorado|
-1.366​
|
0.056​
|
-1.309​
|
30​
|

Home-ice advantage: +0.316 goals/game.
 

Doctor No

Registered User
Oct 26, 2005
9,250
3,971
hockeygoalies.org
Here are the current SRS tables through two rounds:

Team | 2016-17 Goal Diff | 2016-17 Schedule | 2016-17 Strength | RS
Washington|
0.853​
|
0.071​
|
0.923​
|
1​
|
Pittsburgh|
0.617​
|
0.110​
|
0.727​
|
4​
|
Columbus|
0.529​
|
0.077​
|
0.606​
|
2​
|
Minnesota|
0.632​
|
-0.046​
|
0.586​
|
3​
|
NY Rangers|
0.426​
|
0.058​
|
0.483​
|
5​
|
Edmonton|
0.379​
|
-0.002​
|
0.377​
|
6​
|
Nashville|
0.326​
|
-0.012​
|
0.314​
|
13​
|
Montreal|
0.261​
|
0.037​
|
0.298​
|
8​
|
Anaheim|
0.269​
|
0.000​
|
0.269​
|
10​
|
San Jose|
0.250​
|
0.005​
|
0.255​
|
11​
|
Boston|
0.227​
|
0.012​
|
0.240​
|
9​
|
Chicago|
0.244​
|
-0.025​
|
0.220​
|
7​
|
St. Louis|
0.172​
|
0.029​
|
0.201​
|
12​
|
Toronto|
0.080​
|
0.070​
|
0.150​
|
14​
|
Tampa Bay|
0.085​
|
0.016​
|
0.102​
|
15​
|
Ottawa|
-0.011​
|
0.063​
|
0.053​
|
18​
|
NY Islanders|
-0.012​
|
0.054​
|
0.042​
|
16​
|
Calgary|
0.000​
|
-0.013​
|
-0.013​
|
17​
|
Los Angeles|
-0.049​
|
-0.010​
|
-0.059​
|
19​
|
Winnipeg|
-0.085​
|
-0.018​
|
-0.104​
|
20​
|
Philadelphia|
-0.207​
|
0.045​
|
-0.162​
|
21​
|
Carolina|
-0.256​
|
0.056​
|
-0.200​
|
22​
|
Florida|
-0.329​
|
0.042​
|
-0.287​
|
23​
|
Buffalo|
-0.439​
|
0.045​
|
-0.394​
|
24​
|
Detroit|
-0.451​
|
0.048​
|
-0.403​
|
25​
|
Dallas|
-0.476​
|
0.006​
|
-0.470​
|
26​
|
New Jersey|
-0.744​
|
0.087​
|
-0.657​
|
27​
|
Vancouver|
-0.744​
|
0.022​
|
-0.722​
|
28​
|
Arizona|
-0.768​
|
0.020​
|
-0.749​
|
29​
|
Colorado|
-1.366​
|
0.056​
|
-1.310​
|
30​
|
 

Doctor No

Registered User
Oct 26, 2005
9,250
3,971
hockeygoalies.org
Here are the final (inclusive of Stanley Cup playoffs) NHL SRS power ratings for the 2016-2017 season:

Team | 2016-17 Goal Diff | 2016-17 Schedule | 2016-17 Strength | RS
Washington|
0.853​
|
0.073​
|
0.926​
|
1​
|
Pittsburgh|
0.636​
|
0.117​
|
0.752​
|
4​
|
Columbus|
0.529​
|
0.079​
|
0.608​
|
2​
|
Minnesota|
0.632​
|
-0.047​
|
0.585​
|
3​
|
NY Rangers|
0.426​
|
0.060​
|
0.485​
|
5​
|
Edmonton|
0.379​
|
-0.006​
|
0.373​
|
6​
|
Nashville|
0.269​
|
0.046​
|
0.315​
|
13​
|
Montreal|
0.261​
|
0.038​
|
0.299​
|
8​
|
San Jose|
0.250​
|
0.003​
|
0.253​
|
11​
|
Boston|
0.227​
|
0.014​
|
0.241​
|
9​
|
Anaheim|
0.212​
|
0.019​
|
0.231​
|
10​
|
Chicago|
0.244​
|
-0.025​
|
0.219​
|
7​
|
St. Louis|
0.172​
|
0.029​
|
0.201​
|
12​
|
Toronto|
0.080​
|
0.071​
|
0.151​
|
14​
|
Tampa Bay|
0.085​
|
0.017​
|
0.103​
|
15​
|
Ottawa|
-0.050​
|
0.113​
|
0.064​
|
18​
|
NY Islanders|
-0.012​
|
0.056​
|
0.043​
|
16​
|
Calgary|
0.000​
|
-0.016​
|
-0.016​
|
17​
|
Los Angeles|
-0.049​
|
-0.012​
|
-0.061​
|
19​
|
Winnipeg|
-0.085​
|
-0.019​
|
-0.104​
|
20​
|
Philadelphia|
-0.207​
|
0.046​
|
-0.161​
|
21​
|
Carolina|
-0.256​
|
0.057​
|
-0.199​
|
22​
|
Florida|
-0.329​
|
0.043​
|
-0.286​
|
23​
|
Buffalo|
-0.439​
|
0.046​
|
-0.393​
|
24​
|
Detroit|
-0.451​
|
0.049​
|
-0.403​
|
25​
|
Dallas|
-0.476​
|
0.005​
|
-0.471​
|
26​
|
New Jersey|
-0.744​
|
0.088​
|
-0.656​
|
27​
|
Vancouver|
-0.744​
|
0.020​
|
-0.724​
|
28​
|
Arizona|
-0.768​
|
0.018​
|
-0.750​
|
29​
|
Colorado|
-1.366​
|
0.055​
|
-1.310​
|
30​
|

Home-ice advantage ended up at +0.325 goals game.

Barring errors in the underlying data, these will be the values that feed into my goalie statistics (to be posted over the next few days).
 

Doctor No

Registered User
Oct 26, 2005
9,250
3,971
hockeygoalies.org
While I'm here, these were the five most consistent teams over the 2016-2017 season (measured by how predictable the SRS algorithm was for each individual game):

Vancouver (1.72)
Colorado (1.80)
New Jersey (1.81)
Arizona (1.86)
Detroit (1.98)

Random observation - "consistent" and "good" are not necessarily the same (go Avs) :)

And the five least consistent teams:
Pittsburgh (2.63)
Tampa Bay (2.54)
Toronto (2.50)
Montreal (2.48)
NY Islanders (2.41)
 

Ad

Upcoming events

Ad

Ad