NHL Team Power Ratings 2016-17 (SRS Algorithm)

MNNumbers

HFBoards Sponsor
Sponsor
Nov 17, 2011
7,652
2,521
Thanks for the questions.
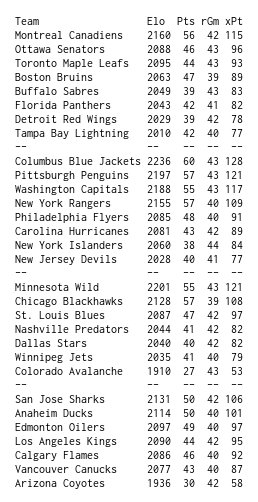
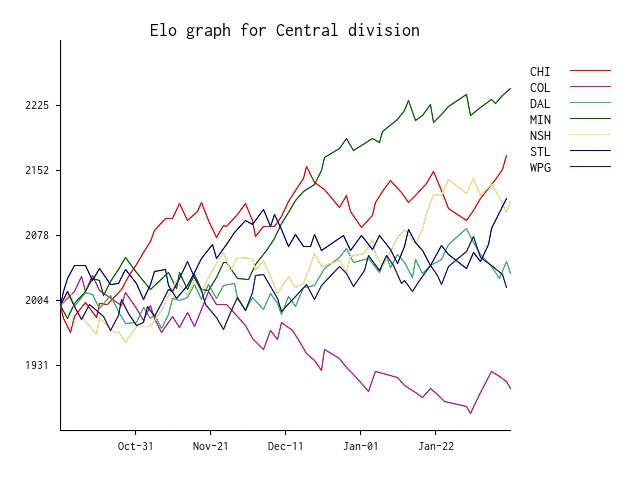
The estimate of how the team would finish comes from the sum of current points and the number of projected remaining points. This latter one is a function of the remaining schedule strength, but also of the number of the remaining games to play.

Also a streaking up team may surpass a streaking down team, or even a level team, in Elo before overtaking it in points.

Regarding the OT and the SO:
1) I treat shootout loss as a 'draw', or score of 0.5 pts (because Elo functions work with 0-1 scale), to compare with expected score. Therefore the ratings tend to inflate over season, unlike in chess where the average stays the same. However since I reset the team ratings to 2000 at the start of the season, the inflation is not important - and the Elo itself only cares about difference between ratings, not their actual values.

2) I calculate the share (P) of game ending in OT/SO and it affects the expectation - the expectation is multiplied by P/2 for ALL teams.

I don't use GD.

Thank you for the response. I looked through your site a little, and I am not a statistician. So, can you answer again and tell me how a team's ELO changes after each game? For example, Right now, CMB are at 2250, MIN are at 2196. They play tomorrow. If Minnesota wins, how do you calculate the new rankings?

Also, are you familiar with the Bradley-Terry method?
 

morehockeystats

Unusual hockey stats
Dec 13, 2016
617
296
Columbus
morehockeystats.com
Thank you for the response. I looked through your site a little, and I am not a statistician. So, can you answer again and tell me how a team's ELO changes after each game? For example, Right now, CMB are at 2250, MIN are at 2196. They play tomorrow. If Minnesota wins, how do you calculate the new rankings?

Also, are you familiar with the Bradley-Terry method?

If Rc = 2250 and Rm = 2196, then dRc = 54 and dRm = -54. The ratings difference is what's important. Expected results are, thus: 0.577*2=1.154 for CBJ and 0.423*2 = 0.846 for MIN. The rating change is K*(real_result-expected_result) where K is a volatility coefficient which is by default 32, but since the scores are "doubled" from chess, I use 16.

Here's a small table of all actual outcomes:

TEM RS C M dRestC dRestM dRcbj dRmin Rcbj' Rmin'
CBJ RW 2 0 +0.846 -0.846 +13.53 -13.53 2263 2182
CBJ OW 2 1 +0.846 +0.154 +13.53 +02.97 2263 2199
MIN OW 1 2 -0.154 +1.154 -02.97 +18.47 2247 2214
MIN RW 0 2 -1.154 +1.154 -18.47 +18.47 2232 2214

However, usually, I don't recalculate ratings after each game, but rather average bulks of five games. The graphs are with changes after every game.

I am not familiar with the Bradley-Terry method. I come from the world of chess. :)
I wrote a blog entry on the issue:
http://morehockeystats.blogspot.com/2016/12/on-players-evaluation-part-ii-elo.html
 

morehockeystats

Unusual hockey stats
Dec 13, 2016
617
296
Columbus
morehockeystats.com
I dont really follow chess so sorry for the off topic, but isn't there a pretty big difference in winrate between White and Black, like if White plays it perfectly black does not have a chance to win in theory?

I will check your site though, thanks for providing this. It's really interesting :)

The general consensus is that if White and Black play perfectly, it's a draw. :)
However the perfect play has been escaping even the computers so far.

A ranked-100 in the world GM can force a draw against a ranked-10 playing with White, really really carefully.

Overall the score is around 57% White 43% Black. Something like 30% white win 16% black win 54% draw on the top level. Draw is considered a perfectly valid result in chess and very rarely are tie-breaks played over a single game draw results.
 

MNNumbers

HFBoards Sponsor
Sponsor
Nov 17, 2011
7,652
2,521
If Rc = 2250 and Rm = 2196, then dRc = 54 and dRm = -54. The ratings difference is what's important. Expected results are, thus: 0.577*2=1.154 for CBJ and 0.423*2 = 0.846 for MIN. The rating change is K*(real_result-expected_result) where K is a volatility coefficient which is by default 32, but since the scores are "doubled" from chess, I use 16.

Here's a small table of all actual outcomes:

TEM RS C M dRestC dRestM dRcbj dRmin Rcbj' Rmin'
CBJ RW 2 0 +0.846 -0.846 +13.53 -13.53 2263 2182
CBJ OW 2 1 +0.846 +0.154 +13.53 +02.97 2263 2199
MIN OW 1 2 -0.154 +1.154 -02.97 +18.47 2247 2214
MIN RW 0 2 -1.154 +1.154 -18.47 +18.47 2232 2214

However, usually, I don't recalculate ratings after each game, but rather average bulks of five games. The graphs are with changes after every game.

I am not familiar with the Bradley-Terry method. I come from the world of chess. :)
I wrote a blog entry on the issue:
http://morehockeystats.blogspot.com/2016/12/on-players-evaluation-part-ii-elo.html

Bradley-terry has been used in chess. Example....

A big tournament with several people with not enough time to play a full round-robin. How do you rank the results?

So, starting from scratch....

Assume that there is a Power Number for each player such that:

Sum (pn1/(pn1 +pn2)) over all opponents = # of wins for Player Number 1 for example. Where pn 1= Player 1's power Number, pn2 = Players 2's Power Number.

As it happens, the odds of winning the match are also pn1/(pn1+pn2).

It is possible to calculate the Power Numbers of all players, provided that one assumption is true:
All players have lost to someone who lost to someone who lost to someone.....in a chain that reaches to all players.

Since in a chess tournament, there are many draws, draws count 1/2 a win, and that assumption is quickly true.

This method has been commonly applied to College Hockey, and is called KRACH.

It actually works better in NHL, because the schedule is less insular. And, it works worse, because of the OT system.

I appreciate your fix, which as you say, inflates the numbers over time.

I personally believe that, since we are talking about a quality of the team concept, that it is better to count the overtime results less, since they are not like real 5x5 hockey, and therefore the results are less indicative of quality of play. For this reason, no system is going to be perfect.

And, I use 2/3 of a win for an ot/so win, and 1/3 of a win, for an ot/so loss.

I'll post my Bradley-Terry Rankings for the season so far later tonight or tomorrow.
 

morehockeystats

Unusual hockey stats
Dec 13, 2016
617
296
Columbus
morehockeystats.com
Bradley-terry has been used in chess. Example....

A big tournament with several people with not enough time to play a full round-robin. How do you rank the results?

So, starting from scratch....

Assume that there is a Power Number for each player such that:

Sum (pn1/(pn1 +pn2)) over all opponents = # of wins for Player Number 1 for example. Where pn 1= Player 1's power Number, pn2 = Players 2's Power Number.

As it happens, the odds of winning the match are also pn1/(pn1+pn2).

It is possible to calculate the Power Numbers of all players, provided that one assumption is true:
All players have lost to someone who lost to someone who lost to someone.....in a chain that reaches to all players.

Since in a chess tournament, there are many draws, draws count 1/2 a win, and that assumption is quickly true.

This method has been commonly applied to College Hockey, and is called KRACH.

It actually works better in NHL, because the schedule is less insular. And, it works worse, because of the OT system.

I appreciate your fix, which as you say, inflates the numbers over time.

I personally believe that, since we are talking about a quality of the team concept, that it is better to count the overtime results less, since they are not like real 5x5 hockey, and therefore the results are less indicative of quality of play. For this reason, no system is going to be perfect.

And, I use 2/3 of a win for an ot/so win, and 1/3 of a win, for an ot/so loss.

I'll post my Bradley-Terry Rankings for the season so far later tonight or tomorrow.

There is a highly efficient system of having tournaments with too many players for a round robin. It's called the Swiss system. The tie-breaks in it vary, but most of them are valid and widely accepted, and none has anything to do with BT. Apart of this and the knock-out system, I haven't been aware of any other systems being used in massive chess tournaments (I am an National Arbiter in chess)...

I did try to work with 1, 2/3, 1/3 and 0, but it fails at the end. Elo MUST reflect the result and the expected result on the same scale. If the NHL switches to 3-2-1-0, then it'll make life easier for Elo too.

And the inflation, as I said, is a non-issue from my PoV, because
a) only the difference matters, not the absolute values.
b) at the start of each season I reset the ratings.
 

MNNumbers

HFBoards Sponsor
Sponsor
Nov 17, 2011
7,652
2,521
There is a highly efficient system of having tournaments with too many players for a round robin. It's called the Swiss system. The tie-breaks in it vary, but most of them are valid and widely accepted, and none has anything to do with BT. Apart of this and the knock-out system, I haven't been aware of any other systems being used in massive chess tournaments (I am an National Arbiter in chess)...

I did try to work with 1, 2/3, 1/3 and 0, but it fails at the end. Elo MUST reflect the result and the expected result on the same scale. If the NHL switches to 3-2-1-0, then it'll make life easier for Elo too.

And the inflation, as I said, is a non-issue from my PoV, because
a) only the difference matters, not the absolute values.
b) at the start of each season I reset the ratings.


Very curious...

Why is this expression present:
In practice a non-analytical table-defined function is used that relates only on the difference between Ra and Rb, and not their actual values. The function can be reliably approximated by the following expression:
E = 1 / [ 1 + 10(Rb-Ra) / 400 ]


Or, more specifically, what is the theoretical basis behind the use of the 10 and the 400?

Not arguing one to be better than another, but in B-T, it is the ratio, rather than the difference, that gives the expected result. Thus, it makes no difference the starting parameters, because the ratio will be the same, even if the scale is different.
 

MNNumbers

HFBoards Sponsor
Sponsor
Nov 17, 2011
7,652
2,521
Bradley-Terry Ranking System NHL Rankings as of Dec 30.

Cmb...238.6
Pit.....189.3
NYR...168.8
Min....163.8
Mont..163.0
SJS...147.6
Was...133.0
Chi....119.5
Ana...113.5
Ott....107.1
StL....105.6
Edm...103.0
Bos....97.0
Car....92.5
TBL....90.7
Phi....86.6
Nas...84.8
Cgy....84.7
Tor.....83.7
NYI....82.4
Dal....80.8
LAK...97.1
Buf....683.
Wpg...66.0
Det....62.8
Fla.....62.4
NJD....62.3
Van....57.1
Ari.....42.1
Col....42.1

These rankings take into consideration who you have played, who they have played...etc. They are on an odds scale, meaning that your odds of winning the game are (your score)/(your score + opponents score).

They are not perfect for NHL, because the 3on3 and the SO do not represent 5on5 hockey, and so it is difficult to know the best way to incorporate them.

For this method, one needs to know only how many games each team has played against every other team, and the number of total wins of each team. The math does the rest. I have chosen to use OTW=2/3 of a win, OTL=1/3 of a win. That's my best guess.

Clearly, these rankings believe the standings, in that the METRO ranks very high, and the Eastern Conference generally does better.

Cheers....
 

morehockeystats

Unusual hockey stats
Dec 13, 2016
617
296
Columbus
morehockeystats.com
Very curious...

Why is this expression present:
In practice a non-analytical table-defined function is used that relates only on the difference between Ra and Rb, and not their actual values. The function can be reliably approximated by the following expression:
E = 1 / [ 1 + 10(Rb-Ra) / 400 ]


Or, more specifically, what is the theoretical basis behind the use of the 10 and the 400?

Not arguing one to be better than another, but in B-T, it is the ratio, rather than the difference, that gives the expected result. Thus, it makes no difference the starting parameters, because the ratio will be the same, even if the scale is different.
Originally, it wasn't a function per se.
As I said in the blog post you quote, FIDE uses not the analytical function, but rather a table function. The table function is maintained by FIDE, but I assume, it inherits a lot from Arpad Elo himself.

The 10 and 400 approximation comes, I think, from the USCF, and the authority is Mark Glickman, e.g. here, page 11, section 4.2 at the bottom.

There is no rating system so accepted and welcome in its area, as the Elo system in chess (and other board games embracing it is another evidence), and the main objections to it usually come about the K volatility coefficient abuse; however this is not applicable, let's say, to top-100.
 

morehockeystats

Unusual hockey stats
Dec 13, 2016
617
296
Columbus
morehockeystats.com
They are not perfect for NHL, because the 3on3 and the SO do not represent 5on5 hockey, and so it is difficult to know the best way to incorporate them.

For this method, one needs to know only how many games each team has played against every other team, and the number of total wins of each team. The math does the rest. I have chosen to use OTW=2/3 of a win, OTL=1/3 of a win. That's my best guess.

Clearly, these rankings believe the standings, in that the METRO ranks very high, and the Eastern Conference generally does better.

Cheers....

Once again, I don't see a problem with 3on3 and SO not representing 5on5. It's part of the game that we measure, and the game we measure is not an abstract hockey, is the NHL regular season hockey which incorporates 3on3 and SO :). That's why my points projections are multiplied by 1.124 right now from what pure Elo gives.

The problem with 2/3 for OT is that in reality, in the standings, the team's gain has been 1 and not 2/3 after the OT win, and 1/2 and not 1/3 after the OT loss.
 

MNNumbers

HFBoards Sponsor
Sponsor
Nov 17, 2011
7,652
2,521
Once again, I don't see a problem with 3on3 and SO not representing 5on5. It's part of the game that we measure, and the game we measure is not an abstract hockey, is the NHL regular season hockey which incorporates 3on3 and SO :). That's why my points projections are multiplied by 1.124 right now from what pure Elo gives.

The problem with 2/3 for OT is that in reality, in the standings, the team's gain has been 1 and not 2/3 after the OT win, and 1/2 and not 1/3 after the OT loss.

Once again, I see your point, and I do not mean to argue. It is not a matter of competing evaluations.

My own thought about 3v3 and the SO is this:
If it were true that they were equivalent to 5v5 hockey, then to some approximation, the OT/SO record of teams would run parallel to their record in games decided in regulation. Looking at the standings, that is clearly not the case. Therefore, in my mind, something else is being measured there.

What I like about ELO is that it incorporates 'recent strength' to some extent. What I don't like as well is that a win against a team who looks strong after 5 games gives me a large boost, when, 5 games later, it may be clear that team is not as strong as it appeared. However, I still get the BIG points anyway. In a game like hockey, which often is decided on breaks and puck-luck in short bursts anyway, I don't think that is so good.

Just my opinion. Like I say....Respect!!

ETA: Again, another thing I like about ELO is it can be used in a situation where the 'start point' of the ranking varies from one player to another - as in the case of Chess, where some players are 10 or more years older than others. It is not a 'closed league' system.
 
Last edited:

morehockeystats

Unusual hockey stats
Dec 13, 2016
617
296
Columbus
morehockeystats.com
Once again, I see your point, and I do not mean to argue. It is not a matter of competing evaluations.

My own thought about 3v3 and the SO is this:
If it were true that they were equivalent to 5v5 hockey, then to some approximation, the OT/SO record of teams would run parallel to their record in games decided in regulation. Looking at the standings, that is clearly not the case. Therefore, in my mind, something else is being measured there.

What I like about ELO is that it incorporates 'recent strength' to some extent. What I don't like as well is that a win against a team who looks strong after 5 games gives me a large boost, when, 5 games later, it may be clear that team is not as strong as it appeared. However, I still get the BIG points anyway. In a game like hockey, which often is decided on breaks and puck-luck in short bursts anyway, I don't think that is so good.

Just my opinion. Like I say....Respect!!

ETA: Again, another thing I like about ELO is it can be used in a situation where the 'start point' of the ranking varies from one player to another - as in the case of Chess, where some players are 10 or more years older than others. It is not a 'closed league' system.
Just a few very minor remarks:
  • it's Elo, not ELO, since it's a last name. :)
  • it's preferred, at least in chess, to "commit" the rating changes only after a number of games, at least three (or a fixed span of time, e.g. ten days); the ratings of the teams stay constant during that period. I toyed with numbers of days and games, and found five games to produce the most reliable results.

I am not arguing neither against you, nor against the BT. We shall chug along and compare, and refine. :)
 

Doctor No

Registered User
Oct 26, 2005
9,250
3,971
hockeygoalies.org
SRS power ratings for NHL games through January 1, 2017:

Team | 2016-17 Goal Diff | 2016-17 Schedule | 2016-17 Strength
Columbus|
1.429​
|
-0.016​
|
1.412​
|
NY Rangers|
0.974​
|
-0.068​
|
0.907​
|
Minnesota|
1.028​
|
-0.130​
|
0.897​
|
Montreal|
0.730​
|
0.035​
|
0.765​
|
Pittsburgh|
0.684​
|
0.073​
|
0.757​
|
Washington|
0.583​
|
-0.030​
|
0.553​
|
San Jose|
0.378​
|
0.104​
|
0.482​
|
Chicago|
0.359​
|
-0.120​
|
0.239​
|
Edmonton|
0.237​
|
-0.054​
|
0.183​
|
Tampa Bay|
0.105​
|
0.020​
|
0.126​
|
Boston|
0.026​
|
0.086​
|
0.112​
|
Los Angeles|
0.027​
|
0.079​
|
0.106​
|
Toronto|
0.139​
|
-0.057​
|
0.082​
|
Anaheim|
-0.051​
|
0.077​
|
0.025​
|
Carolina|
-0.111​
|
0.097​
|
-0.014​
|
NY Islanders|
-0.250​
|
0.180​
|
-0.070​
|
St. Louis|
-0.162​
|
0.071​
|
-0.091​
|
Ottawa|
-0.108​
|
0.007​
|
-0.101​
|
Nashville|
0.056​
|
-0.166​
|
-0.111​
|
Philadelphia|
-0.103​
|
-0.059​
|
-0.162​
|
Calgary|
-0.154​
|
-0.026​
|
-0.179​
|
Florida|
-0.316​
|
0.017​
|
-0.299​
|
Detroit|
-0.378​
|
-0.029​
|
-0.408​
|
Winnipeg|
-0.359​
|
-0.064​
|
-0.423​
|
Dallas|
-0.421​
|
-0.100​
|
-0.521​
|
Vancouver|
-0.526​
|
-0.023​
|
-0.549​
|
Buffalo|
-0.639​
|
0.063​
|
-0.576​
|
New Jersey|
-0.757​
|
0.124​
|
-0.633​
|
Arizona|
-1.054​
|
0.077​
|
-0.977​
|
Colorado|
-1.333​
|
0.071​
|
-1.262​
|

The value of home-ice advantage is now estimated at +0.391 goals/game.

My Colorado Avalanche continue to reach new highslows.
 

Doctor No

Registered User
Oct 26, 2005
9,250
3,971
hockeygoalies.org
My faves, the Colorado Avalanche, are now estimated to be 1.309 goals/game worse than the average NHL team - by far, the worst team in the NHL (Arizona is at -1.039, and the next worst is at -0.507).

The Buffalo Sabres of two years ago (the ones every still accuses of tanking) finished the season at -1.322 goals/game.

Go Avalanche! :handclap:
 

MNNumbers

HFBoards Sponsor
Sponsor
Nov 17, 2011
7,652
2,521
Sun Eve Jan 8 Bradley-Terry Rankings (Normalized with Points/2/(league avg pts/gm) used for wins - which satisfies morehockeystats requirement that the ranking system mimics the NHL points system).

Atl
----
Mtl 158.87
Ott 106.67
Bos 90.56
Tor 85.00
TBL 82.28
Buf 78.43
Flo 76.83
Det 72.39

Met
-----
Cmb 236.34
Pit 182.52
Was 161.98
NYR 143.92
Phil 95.97
Car 90.22
NYI 83.33
NJD 72.97


Cen
-----
Min 148.22
Chi 126.21
StL 105.80
Nas 74.29
Dal 71.62
Wpg 67.06
Col 40.56

Pac
-----
SJS 126.43
Ana 108.52
Edm 99.17
LAK 95.34
Cgy 85.27
Van 73.77
Arz 46.97

This system uses current record and current schedule and reiterative process to arrive at the rankings. Rankings are on an odd scale, which means that the odds, for example, of Min defeating Chi are (Min ranking)/(min ranking + Chi ranking). And, it also means that you can sum that odds number for the entire season for all games played so far, and then multiply by the league average pts/gm (which sits at 1.13 about due to OT/SO games) and you will arrive at each teams' current point total within a rounding error in the hundredths place.


Conclusions: So far, Toronto has played a weaker sched than Boston.
Also, Edm and Cgy have played weaker schedules than the other Pac teams.

Overall, this method closely mimics the Pts/gam Standings method, and it will get closer to that as the season goes on, because, within each division and then conference, the schedule gets closer to balanced as time wears on.

One further point. The East is stronger this year by overall record against the west, and this is borne out by the above, since Minnesota, in spite of having the 3rd best record overall, falls behind both Was and Mtl in the Bradley-Terry, by about 3-4%. This is entirely due to schedule strength, and is attributable to the East being stronger.
 

Doctor No

Registered User
Oct 26, 2005
9,250
3,971
hockeygoalies.org
NHL games through January 8, 2017:

Team | 2016-17 Goal Diff | 2016-17 Schedule | 2016-17 Strength
Columbus|
1.205​
|
0.007​
|
1.212​
|
NY Rangers|
0.929​
|
-0.034​
|
0.894​
|
Minnesota|
0.974​
|
-0.081​
|
0.894​
|
Pittsburgh|
0.769​
|
0.053​
|
0.822​
|
Montreal|
0.775​
|
0.013​
|
0.788​
|
Washington|
0.718​
|
-0.012​
|
0.706​
|
San Jose|
0.375​
|
0.086​
|
0.461​
|
Chicago|
0.372​
|
-0.116​
|
0.256​
|
Edmonton|
0.167​
|
-0.002​
|
0.164​
|
Los Angeles|
-0.025​
|
0.101​
|
0.076​
|
Toronto|
0.103​
|
-0.032​
|
0.071​
|
Boston|
0.000​
|
0.058​
|
0.058​
|
Anaheim|
0.000​
|
0.048​
|
0.048​
|
Carolina|
-0.100​
|
0.094​
|
-0.006​
|
Ottawa|
-0.077​
|
0.027​
|
-0.050​
|
St. Louis|
-0.100​
|
0.039​
|
-0.061​
|
Nashville|
0.050​
|
-0.119​
|
-0.069​
|
Calgary|
-0.071​
|
-0.082​
|
-0.154​
|
Philadelphia|
-0.143​
|
-0.017​
|
-0.160​
|
NY Islanders|
-0.289​
|
0.124​
|
-0.166​
|
Tampa Bay|
-0.214​
|
0.028​
|
-0.186​
|
Winnipeg|
-0.238​
|
-0.065​
|
-0.303​
|
Detroit|
-0.375​
|
-0.016​
|
-0.391​
|
Buffalo|
-0.513​
|
0.089​
|
-0.424​
|
Florida|
-0.439​
|
0.000​
|
-0.439​
|
Vancouver|
-0.381​
|
-0.092​
|
-0.473​
|
Dallas|
-0.450​
|
-0.066​
|
-0.516​
|
New Jersey|
-0.634​
|
0.108​
|
-0.526​
|
Arizona|
-1.050​
|
0.061​
|
-0.989​
|
Colorado|
-1.308​
|
0.042​
|
-1.265​
|

Home-ice advantage is currently estimated at +0.379 goals/game.
 

morehockeystats

Unusual hockey stats
Dec 13, 2016
617
296
Columbus
morehockeystats.com
And the Elos:

C1vP7TmVEAAF2Lg.jpg
 

MNNumbers

HFBoards Sponsor
Sponsor
Nov 17, 2011
7,652
2,521
I'm quite sorry MODS. I intended to post this here, and not in the Elo thread. I would have deleted my post there, but it was already quoted, and that would lead to confusion.

Here is the Bradley-Terry Rankings for Jan 22.

The Rankings:

Atlantic:
Mont 139
Ott 122
Tor 94
Bos 82
Buf 81
Det 80
TBL 79
Flo 78

Metro
Cmb 194
Wash 192
Pitt 174
NYR 129
Car 94
NYI 87
Phi 87
NJD 80

Cent
Min 148
Chi 127
StL 92
Nsh 87
Dal 70
Wpg 67
Col 37

Pac
SJS 127
Ana 114
Edm 107
LAK 85
Cgy 77
Van 76
Arz 46


Comments:
Generally, the weakness of Col and Arz pulls the West down because they play them more.
Also, it would seem that Ottawa has played a more difficult sched than Toronto thus far.
 

Doctor No

Registered User
Oct 26, 2005
9,250
3,971
hockeygoalies.org
Here are the SRS power ratings for NHL games through January 22, 2017:

Team | 2016-17 Goal Diff | 2016-17 Schedule | 2016-17 Strength
Washington|
1.065​
|
0.035​
|
1.101​
|
Columbus|
1.065​
|
-0.006​
|
1.059​
|
Pittsburgh|
0.761​
|
0.130​
|
0.891​
|
Minnesota|
1.000​
|
-0.114​
|
0.886​
|
NY Rangers|
0.830​
|
-0.018​
|
0.811​
|
Montreal|
0.479​
|
0.064​
|
0.543​
|
San Jose|
0.383​
|
0.025​
|
0.408​
|
Edmonton|
0.265​
|
-0.062​
|
0.204​
|
Chicago|
0.306​
|
-0.115​
|
0.191​
|
Ottawa|
0.044​
|
0.102​
|
0.146​
|
Toronto|
0.114​
|
0.011​
|
0.125​
|
Anaheim|
0.143​
|
-0.049​
|
0.094​
|
Nashville|
0.170​
|
-0.144​
|
0.026​
|
Carolina|
-0.130​
|
0.154​
|
0.023​
|
Los Angeles|
-0.043​
|
0.047​
|
0.004​
|
NY Islanders|
-0.089​
|
0.084​
|
-0.005​
|
Boston|
-0.120​
|
0.053​
|
-0.067​
|
Tampa Bay|
-0.250​
|
0.044​
|
-0.206​
|
St. Louis|
-0.277​
|
0.063​
|
-0.214​
|
Calgary|
-0.163​
|
-0.092​
|
-0.255​
|
Buffalo|
-0.391​
|
0.086​
|
-0.305​
|
Winnipeg|
-0.224​
|
-0.081​
|
-0.306​
|
Detroit|
-0.340​
|
0.010​
|
-0.331​
|
Philadelphia|
-0.375​
|
-0.003​
|
-0.378​
|
Florida|
-0.438​
|
0.024​
|
-0.413​
|
New Jersey|
-0.542​
|
0.115​
|
-0.426​
|
Vancouver|
-0.396​
|
-0.088​
|
-0.484​
|
Dallas|
-0.458​
|
-0.036​
|
-0.495​
|
Arizona|
-1.043​
|
0.043​
|
-1.000​
|
Colorado|
-1.341​
|
0.039​
|
-1.302​
|

Washington jumped back into the lead on January 19th, and my Avalanche have earned a point in every game played under the new presidential administration.

Home-ice advantage is currently estimated at +0.356 goals/game.
 

Doctor No

Registered User
Oct 26, 2005
9,250
3,971
hockeygoalies.org
NHL games through February 5, 2017:

Team | 2016-17 Goal Diff | 2016-17 Schedule | 2016-17 Strength
Washington|
1.151​
|
0.034​
|
1.185​
|
Minnesota|
1.039​
|
-0.112​
|
0.928​
|
Columbus|
0.843​
|
0.038​
|
0.881​
|
Pittsburgh|
0.725​
|
0.134​
|
0.859​
|
NY Rangers|
0.731​
|
-0.023​
|
0.708​
|
Montreal|
0.444​
|
0.064​
|
0.509​
|
San Jose|
0.434​
|
-0.026​
|
0.408​
|
Edmonton|
0.273​
|
-0.004​
|
0.269​
|
Ottawa|
0.040​
|
0.096​
|
0.136​
|
Toronto|
0.120​
|
-0.004​
|
0.116​
|
Los Angeles|
0.075​
|
0.029​
|
0.104​
|
NY Islanders|
-0.020​
|
0.118​
|
0.098​
|
Chicago|
0.204​
|
-0.124​
|
0.080​
|
Anaheim|
0.111​
|
-0.077​
|
0.034​
|
Nashville|
0.135​
|
-0.119​
|
0.016​
|
Carolina|
-0.157​
|
0.149​
|
-0.008​
|
Boston|
-0.109​
|
0.071​
|
-0.038​
|
St. Louis|
-0.288​
|
0.097​
|
-0.191​
|
Tampa Bay|
-0.245​
|
0.034​
|
-0.212​
|
Calgary|
-0.200​
|
-0.036​
|
-0.236​
|
Buffalo|
-0.353​
|
0.108​
|
-0.245​
|
Winnipeg|
-0.200​
|
-0.090​
|
-0.290​
|
Philadelphia|
-0.340​
|
0.021​
|
-0.318​
|
Florida|
-0.365​
|
-0.007​
|
-0.372​
|
Detroit|
-0.385​
|
0.009​
|
-0.376​
|
New Jersey|
-0.509​
|
0.129​
|
-0.380​
|
Dallas|
-0.415​
|
-0.048​
|
-0.463​
|
Vancouver|
-0.519​
|
-0.092​
|
-0.611​
|
Arizona|
-0.882​
|
0.010​
|
-0.873​
|
Colorado|
-1.408​
|
0.022​
|
-1.387​
|

Home-ice advantage is currently estimated at +0.339 goals/game.
 

MNNumbers

HFBoards Sponsor
Sponsor
Nov 17, 2011
7,652
2,521
Sunday Evening Feb 12, NHL Bradley-Terry Power Rankings.

Eastern Conference:
Metro Division
Wash 199.3
Colum 164.9
Pitt 164.6
NYR 143.1
NYI 96.5
Phil 90.8
Car 90.3
NJD 82.3

Atlantic Division
Ott 118.2
Mont 113.4
Bost 94.7
Tor 89.6
Flor 86.2
Tam 86.1
Buff 80.0
Det 75.2

Western Conference:
Central Division
Minn 162.2
Chi 126.1
StL 101.9
Nas 87.5
Dal 67.4
Wpg 63.8
Col 35.1

Pacific Division
SJose 124.6
Ana 104.3
Edm 104.2
LAK 90.4
Cgy 83.2
Vanc 72.3
Arz 53.8

Significant Comments:
Ottawa has played a tougher schedule that Montreal – so says the math. NHL Standings show this to be closer than any of us might have expected it to get.

Boston gets a higher grade than Toronto as well. Again, it must be due to scheduling.

Nothing really surprising in the West.
 

Doctor No

Registered User
Oct 26, 2005
9,250
3,971
hockeygoalies.org
SRS algorithm, NHL power ratings through February 12, 2017:

Team | 2016-17 Goal Diff | 2016-17 Schedule | 2016-17 Strength | Last Week
Washington|
1.268​
|
-0.001​
|
1.267​
|
1​
|
Minnesota|
1.055​
|
-0.113​
|
0.941​
|
2​
|
Columbus|
0.778​
|
0.017​
|
0.795​
|
3​
|
Pittsburgh|
0.704​
|
0.083​
|
0.787​
|
4​
|
NY Rangers|
0.800​
|
-0.061​
|
0.739​
|
5​
|
San Jose|
0.368​
|
-0.031​
|
0.337​
|
7​
|
Montreal|
0.259​
|
0.027​
|
0.286​
|
6​
|
Chicago|
0.333​
|
-0.087​
|
0.246​
|
13​
|
Edmonton|
0.196​
|
-0.004​
|
0.193​
|
8​
|
NY Islanders|
0.056​
|
0.080​
|
0.136​
|
12​
|
Boston|
0.034​
|
0.044​
|
0.078​
|
17​
|
Ottawa|
0.000​
|
0.067​
|
0.067​
|
9​
|
Los Angeles|
0.036​
|
0.018​
|
0.054​
|
11​
|
Toronto|
0.074​
|
-0.021​
|
0.054​
|
10​
|
St. Louis|
-0.071​
|
0.107​
|
0.035​
|
18​
|
Anaheim|
0.070​
|
-0.042​
|
0.028​
|
14​
|
Nashville|
0.125​
|
-0.107​
|
0.018​
|
15​
|
Tampa Bay|
-0.107​
|
0.036​
|
-0.071​
|
19​
|
Carolina|
-0.302​
|
0.162​
|
-0.140​
|
16​
|
Calgary|
-0.179​
|
-0.012​
|
-0.190​
|
20​
|
Buffalo|
-0.375​
|
0.080​
|
-0.295​
|
21​
|
Philadelphia|
-0.375​
|
0.016​
|
-0.359​
|
23​
|
Florida|
-0.352​
|
-0.010​
|
-0.362​
|
24​
|
Winnipeg|
-0.328​
|
-0.051​
|
-0.379​
|
22​
|
New Jersey|
-0.527​
|
0.121​
|
-0.406​
|
26​
|
Detroit|
-0.500​
|
0.074​
|
-0.426​
|
25​
|
Dallas|
-0.421​
|
-0.023​
|
-0.444​
|
27​
|
Vancouver|
-0.446​
|
-0.059​
|
-0.506​
|
28​
|
Arizona|
-0.849​
|
0.018​
|
-0.831​
|
29​
|
Colorado|
-1.396​
|
0.067​
|
-1.329​
|
30​
|

Home-ice advantage is currently estimated at +0.331 goals/game.

I added a column to show the team's ranking last week.
 

Ad

Upcoming events

Ad

Ad

-->