NHL Team Power Ratings 2016-17 (SRS Algorithm)

Doctor No

Registered User
Oct 26, 2005
9,250
3,971
hockeygoalies.org
The data are still rather immature for the 2016-17 season, and this algorithm assumes 100% credibility on the current season (some algorithms weight the current season with past years' data for the first few weeks or months).

Here's the past few seasons' numbers, along with some explanation thrown in:
http://hfboards.mandatory.com/showthread.php?t=1865419

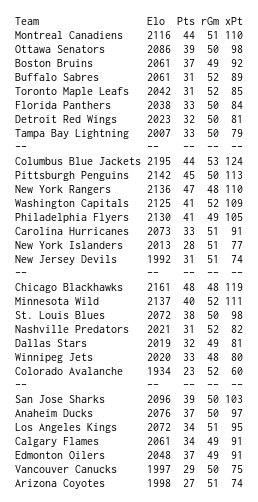
Anyhow, the units in this table are goals/game. When you see "Montreal +1.795", it means that Montreal would be favored to win a game by 1.795 goals (against an average team on neutral ice).

This is built from two components: Montreal's average margin of victory so far this season is +1.889, and their average opponent strength is -0.094.

Average opponent strength is the average of the SRS algorithm's ratings for the Canadiens' opponents to date, which is an iterative process - the SRS rating is based (in part) on the opponents' average SRS rating, which are in turn based on *their* opponents' average ratings, and so forth.
 

Doctor No

Registered User
Oct 26, 2005
9,250
3,971
hockeygoalies.org
NHL games through October 30, 2016:

Team | 2016-17 Goal Diff | 2016-17 Schedule | 2016-17 Strength
Montreal|
1.889​
|
-0.094​
|
1.795​
|
NY Rangers|
1.444​
|
0.066​
|
1.511​
|
Minnesota|
1.444​
|
-0.250​
|
1.194​
|
Washington|
0.625​
|
0.315​
|
0.940​
|
Edmonton|
1.111​
|
-0.227​
|
0.884​
|
NY Islanders|
0.222​
|
0.337​
|
0.559​
|
Detroit|
0.400​
|
0.062​
|
0.462​
|
Florida|
0.222​
|
0.238​
|
0.460​
|
New Jersey|
0.250​
|
0.045​
|
0.295​
|
Tampa Bay|
-0.222​
|
0.512​
|
0.290​
|
St. Louis|
0.111​
|
0.135​
|
0.246​
|
Buffalo|
-0.125​
|
0.311​
|
0.186​
|
Ottawa|
0.000​
|
0.142​
|
0.142​
|
San Jose|
0.222​
|
-0.086​
|
0.136​
|
Colorado|
0.000​
|
-0.066​
|
-0.066​
|
Boston|
-0.625​
|
0.530​
|
-0.095​
|
Pittsburgh|
-0.222​
|
0.077​
|
-0.145​
|
Chicago|
0.444​
|
-0.609​
|
-0.165​
|
Columbus|
0.143​
|
-0.385​
|
-0.242​
|
Calgary|
-0.400​
|
0.133​
|
-0.267​
|
Philadelphia|
-0.200​
|
-0.222​
|
-0.422​
|
Toronto|
-1.000​
|
0.465​
|
-0.535​
|
Anaheim|
-0.222​
|
-0.316​
|
-0.538​
|
Arizona|
-1.125​
|
0.549​
|
-0.576​
|
Carolina|
-0.750​
|
0.136​
|
-0.614​
|
Winnipeg|
-0.444​
|
-0.298​
|
-0.742​
|
Vancouver|
-0.778​
|
-0.138​
|
-0.916​
|
Los Angeles|
-0.667​
|
-0.308​
|
-0.975​
|
Nashville|
-1.125​
|
-0.291​
|
-1.416​
|
Dallas|
-1.000​
|
-0.441​
|
-1.441​
|

Home-ice advantage is estimated at +0.500 goals/game, which is still quite high historically (and will surely come down).
 

wgknestrick

Registered User
Aug 14, 2012
5,823
2,403
MTL and MIN are going to fall, fall hard.

MTL 5v5:
less than 50% SF%, but 70% GF%?
 
Mar 15, 2011
7,206
3
NJ
NHL games through October 30, 2016:

Team | 2016-17 Goal Diff | 2016-17 Schedule | 2016-17 Strength
Montreal|
1.889​
|
-0.094​
|
1.795​
|
NY Rangers|
1.444​
|
0.066​
|
1.511​
|
Minnesota|
1.444​
|
-0.250​
|
1.194​
|
Washington|
0.625​
|
0.315​
|
0.940​
|
Edmonton|
1.111​
|
-0.227​
|
0.884​
|
NY Islanders|
0.222​
|
0.337​
|
0.559​
|
Detroit|
0.400​
|
0.062​
|
0.462​
|
Florida|
0.222​
|
0.238​
|
0.460​
|
New Jersey|
0.250​
|
0.045​
|
0.295​
|
Tampa Bay|
-0.222​
|
0.512​
|
0.290​
|
St. Louis|
0.111​
|
0.135​
|
0.246​
|
Buffalo|
-0.125​
|
0.311​
|
0.186​
|
Ottawa|
0.000​
|
0.142​
|
0.142​
|
San Jose|
0.222​
|
-0.086​
|
0.136​
|
Colorado|
0.000​
|
-0.066​
|
-0.066​
|
Boston|
-0.625​
|
0.530​
|
-0.095​
|
Pittsburgh|
-0.222​
|
0.077​
|
-0.145​
|
Chicago|
0.444​
|
-0.609​
|
-0.165​
|
Columbus|
0.143​
|
-0.385​
|
-0.242​
|
Calgary|
-0.400​
|
0.133​
|
-0.267​
|
Philadelphia|
-0.200​
|
-0.222​
|
-0.422​
|
Toronto|
-1.000​
|
0.465​
|
-0.535​
|
Anaheim|
-0.222​
|
-0.316​
|
-0.538​
|
Arizona|
-1.125​
|
0.549​
|
-0.576​
|
Carolina|
-0.750​
|
0.136​
|
-0.614​
|
Winnipeg|
-0.444​
|
-0.298​
|
-0.742​
|
Vancouver|
-0.778​
|
-0.138​
|
-0.916​
|
Los Angeles|
-0.667​
|
-0.308​
|
-0.975​
|
Nashville|
-1.125​
|
-0.291​
|
-1.416​
|
Dallas|
-1.000​
|
-0.441​
|
-1.441​
|

Home-ice advantage is estimated at +0.500 goals/game, which is still quite high historically (and will surely come down).

The Devils don't suck anymore!
 

Doctor No

Registered User
Oct 26, 2005
9,250
3,971
hockeygoalies.org
Update, NHL games through November 6, 2016:

Team | 2016-17 Goal Diff | 2016-17 Schedule | 2016-17 Strength
NY Rangers|
2.000​
|
-0.152​
|
1.848​
|
Columbus|
1.100​
|
-0.040​
|
1.060​
|
Minnesota|
1.000​
|
-0.162​
|
0.838​
|
Montreal|
0.917​
|
-0.110​
|
0.807​
|
Washington|
0.818​
|
-0.066​
|
0.752​
|
Tampa Bay|
0.417​
|
0.208​
|
0.625​
|
Chicago|
1.077​
|
-0.482​
|
0.595​
|
Edmonton|
0.692​
|
-0.190​
|
0.502​
|
Pittsburgh|
0.500​
|
-0.075​
|
0.425​
|
New Jersey|
0.091​
|
0.235​
|
0.326​
|
Florida|
0.000​
|
0.200​
|
0.200​
|
Boston|
-0.545​
|
0.709​
|
0.163​
|
Anaheim|
0.385​
|
-0.233​
|
0.152​
|
Buffalo|
0.000​
|
0.058​
|
0.058​
|
Detroit|
0.000​
|
-0.008​
|
-0.008​
|
St. Louis|
-0.231​
|
0.094​
|
-0.137​
|
Philadelphia|
-0.077​
|
-0.074​
|
-0.151​
|
Toronto|
-0.333​
|
0.180​
|
-0.153​
|
NY Islanders|
-0.417​
|
0.239​
|
-0.177​
|
San Jose|
-0.417​
|
0.136​
|
-0.281​
|
Ottawa|
0.091​
|
-0.393​
|
-0.302​
|
Winnipeg|
-0.538​
|
0.143​
|
-0.396​
|
Los Angeles|
-0.333​
|
-0.134​
|
-0.467​
|
Dallas|
-0.583​
|
0.109​
|
-0.475​
|
Nashville|
-0.636​
|
-0.111​
|
-0.748​
|
Carolina|
-0.818​
|
-0.008​
|
-0.826​
|
Colorado|
-1.000​
|
0.145​
|
-0.855​
|
Arizona|
-1.000​
|
0.116​
|
-0.884​
|
Calgary|
-1.071​
|
0.018​
|
-1.053​
|
Vancouver|
-1.167​
|
-0.125​
|
-1.292​
|

Home ice advantage currently estimated at a (still high) 0.536 goals/game.

Bruins have the toughest schedule so far, while Chicago has the easiest.

The difference between last week's SRS and this week's SRS presents a good educational example - the SRS algorithm does not discount outlier results (such as the Canadiens' 10-0 loss to Columbus). Stated differently, the model assumes that there's a chance that this could happen again.

Depending upon how you're using the model, you may find that discounting outliers gives you a more predictive result - although there *is* a chance that this could happen again, when most goal spreads are in the neighborhood of "-0.5" or "-1.5", it's probably not too relevant whether or not Montreal loses by 3-0 or by 10-0.

So if you're following along and want to try things, try that!
 

Doctor No

Registered User
Oct 26, 2005
9,250
3,971
hockeygoalies.org
NHL games through November 13, 2016:

Team | 2016-17 Goal Diff | 2016-17 Schedule | 2016-17 Strength
NY Rangers|
1.813​
|
-0.228​
|
1.584​
|
Montreal|
1.188​
|
-0.072​
|
1.115​
|
Columbus|
1.000​
|
0.111​
|
1.111​
|
Minnesota|
0.929​
|
-0.146​
|
0.783​
|
Boston|
0.188​
|
0.467​
|
0.655​
|
Chicago|
0.938​
|
-0.335​
|
0.603​
|
Pittsburgh|
0.533​
|
0.017​
|
0.550​
|
New Jersey|
0.357​
|
0.067​
|
0.424​
|
Tampa Bay|
0.267​
|
0.154​
|
0.421​
|
San Jose|
0.133​
|
0.272​
|
0.405​
|
Washington|
0.214​
|
-0.040​
|
0.174​
|
Edmonton|
0.313​
|
-0.207​
|
0.106​
|
Anaheim|
0.063​
|
0.030​
|
0.092​
|
Florida|
0.067​
|
0.023​
|
0.090​
|
Nashville|
0.143​
|
-0.100​
|
0.043​
|
Detroit|
-0.125​
|
0.058​
|
-0.067​
|
Los Angeles|
-0.125​
|
0.029​
|
-0.096​
|
Winnipeg|
0.000​
|
-0.176​
|
-0.176​
|
Philadelphia|
-0.250​
|
0.014​
|
-0.236​
|
Ottawa|
0.000​
|
-0.307​
|
-0.307​
|
NY Islanders|
-0.467​
|
0.122​
|
-0.345​
|
Buffalo|
-0.533​
|
0.081​
|
-0.453​
|
St. Louis|
-0.625​
|
0.136​
|
-0.489​
|
Carolina|
-0.571​
|
0.040​
|
-0.532​
|
Toronto|
-0.733​
|
0.128​
|
-0.606​
|
Dallas|
-0.688​
|
0.069​
|
-0.618​
|
Arizona|
-0.786​
|
0.116​
|
-0.669​
|
Colorado|
-1.000​
|
0.037​
|
-0.963​
|
Vancouver|
-0.938​
|
-0.126​
|
-1.064​
|
Calgary|
-1.250​
|
-0.023​
|
-1.273​
|


Home-ice advantage still estimated at a high-for-this-era +0.535 goals/game.
 
Last edited:

Doctor No

Registered User
Oct 26, 2005
9,250
3,971
hockeygoalies.org
NHL games through November 20, 2016:

Team | 2016-17 Goal Diff | 2016-17 Schedule | 2016-17 Strength
NY Rangers|
1.632​
|
-0.088​
|
1.543​
|
Columbus|
1.063​
|
0.226​
|
1.289​
|
Tampa Bay|
0.789​
|
0.057​
|
0.846​
|
Montreal|
0.947​
|
-0.106​
|
0.842​
|
Boston|
0.278​
|
0.438​
|
0.716​
|
Washington|
0.444​
|
0.077​
|
0.521​
|
Minnesota|
0.706​
|
-0.245​
|
0.461​
|
Chicago|
0.684​
|
-0.265​
|
0.419​
|
New Jersey|
0.176​
|
0.142​
|
0.318​
|
Florida|
0.053​
|
0.207​
|
0.260​
|
San Jose|
-0.056​
|
0.220​
|
0.165​
|
Anaheim|
0.211​
|
-0.054​
|
0.156​
|
Pittsburgh|
0.111​
|
0.015​
|
0.126​
|
Edmonton|
0.158​
|
-0.134​
|
0.023​
|
Los Angeles|
0.000​
|
-0.025​
|
-0.025​
|
Toronto|
-0.167​
|
0.061​
|
-0.105​
|
Nashville|
0.000​
|
-0.118​
|
-0.118​
|
St. Louis|
-0.211​
|
0.049​
|
-0.162​
|
Detroit|
-0.263​
|
0.060​
|
-0.203​
|
Winnipeg|
-0.190​
|
-0.039​
|
-0.229​
|
Carolina|
-0.235​
|
0.000​
|
-0.235​
|
Philadelphia|
-0.263​
|
-0.088​
|
-0.351​
|
NY Islanders|
-0.706​
|
0.155​
|
-0.551​
|
Ottawa|
-0.333​
|
-0.280​
|
-0.613​
|
Colorado|
-0.647​
|
0.021​
|
-0.626​
|
Buffalo|
-0.722​
|
0.042​
|
-0.680​
|
Dallas|
-0.737​
|
0.019​
|
-0.718​
|
Arizona|
-0.706​
|
-0.049​
|
-0.755​
|
Calgary|
-0.900​
|
-0.026​
|
-0.926​
|
Vancouver|
-1.053​
|
-0.069​
|
-1.121​
|

Home-ice advantage is now estimated at +0.513 goals/game.
 

Doctor No

Registered User
Oct 26, 2005
9,250
3,971
hockeygoalies.org
I *love* when the Sunday games slate ends early...NHL games through November 27, 2016:

Team | 2016-17 Goal Diff | 2016-17 Schedule | 2016-17 Strength
NY Rangers|
1.217​
|
-0.063​
|
1.154​
|
Columbus|
0.750​
|
0.087​
|
0.837​
|
Montreal|
0.864​
|
-0.119​
|
0.744​
|
Minnesota|
0.762​
|
-0.228​
|
0.534​
|
Tampa Bay|
0.435​
|
0.044​
|
0.479​
|
Washington|
0.429​
|
-0.021​
|
0.408​
|
Boston|
0.136​
|
0.203​
|
0.339​
|
San Jose|
0.182​
|
0.091​
|
0.273​
|
Edmonton|
0.391​
|
-0.151​
|
0.240​
|
Chicago|
0.304​
|
-0.094​
|
0.210​
|
Pittsburgh|
0.045​
|
0.164​
|
0.209​
|
Nashville|
0.286​
|
-0.086​
|
0.199​
|
Los Angeles|
0.136​
|
-0.021​
|
0.115​
|
Anaheim|
0.136​
|
-0.032​
|
0.105​
|
Florida|
-0.045​
|
0.122​
|
0.076​
|
St. Louis|
-0.091​
|
0.106​
|
0.015​
|
New Jersey|
-0.095​
|
0.056​
|
-0.040​
|
Ottawa|
0.000​
|
-0.050​
|
-0.050​
|
Toronto|
-0.143​
|
0.068​
|
-0.075​
|
Carolina|
-0.190​
|
0.087​
|
-0.104​
|
Detroit|
-0.182​
|
0.077​
|
-0.105​
|
Philadelphia|
-0.174​
|
-0.001​
|
-0.175​
|
Winnipeg|
-0.292​
|
-0.010​
|
-0.302​
|
NY Islanders|
-0.700​
|
0.155​
|
-0.545​
|
Buffalo|
-0.667​
|
0.034​
|
-0.632​
|
Arizona|
-0.650​
|
-0.052​
|
-0.702​
|
Colorado|
-0.700​
|
-0.003​
|
-0.703​
|
Dallas|
-0.682​
|
-0.022​
|
-0.704​
|
Calgary|
-0.792​
|
0.081​
|
-0.711​
|
Vancouver|
-0.773​
|
-0.074​
|
-0.847​
|

Home-ice advantage currently estimated at +0.495 goals/game.
 

Doctor No

Registered User
Oct 26, 2005
9,250
3,971
hockeygoalies.org
NHL games through December 4, 2016:

Team | 2016-17 Goal Diff | 2016-17 Schedule | 2016-17 Strength
NY Rangers|
1.154​
|
-0.050​
|
1.104​
|
Columbus|
0.913​
|
-0.005​
|
0.908​
|
Montreal|
0.720​
|
-0.034​
|
0.686​
|
San Jose|
0.360​
|
0.080​
|
0.440​
|
Minnesota|
0.625​
|
-0.191​
|
0.434​
|
Boston|
0.160​
|
0.148​
|
0.308​
|
Tampa Bay|
0.185​
|
0.121​
|
0.306​
|
Pittsburgh|
0.200​
|
0.077​
|
0.277​
|
Edmonton|
0.370​
|
-0.134​
|
0.236​
|
Washington|
0.217​
|
0.014​
|
0.232​
|
Chicago|
0.222​
|
-0.098​
|
0.124​
|
Philadelphia|
0.074​
|
0.013​
|
0.087​
|
Nashville|
0.208​
|
-0.161​
|
0.048​
|
Anaheim|
0.000​
|
0.028​
|
0.028​
|
Florida|
-0.120​
|
0.120​
|
0.000​
|
Los Angeles|
0.000​
|
-0.003​
|
-0.003​
|
St. Louis|
-0.040​
|
0.032​
|
-0.008​
|
Carolina|
-0.280​
|
0.213​
|
-0.067​
|
Ottawa|
0.000​
|
-0.078​
|
-0.078​
|
New Jersey|
-0.125​
|
0.044​
|
-0.081​
|
Detroit|
-0.154​
|
0.045​
|
-0.109​
|
Toronto|
-0.208​
|
0.041​
|
-0.168​
|
NY Islanders|
-0.375​
|
0.093​
|
-0.282​
|
Winnipeg|
-0.250​
|
-0.049​
|
-0.299​
|
Calgary|
-0.393​
|
0.052​
|
-0.340​
|
Buffalo|
-0.542​
|
0.083​
|
-0.459​
|
Arizona|
-0.696​
|
0.034​
|
-0.661​
|
Dallas|
-0.731​
|
-0.040​
|
-0.771​
|
Vancouver|
-0.680​
|
-0.091​
|
-0.771​
|
Colorado|
-0.870​
|
-0.063​
|
-0.933​
|

Home-ice advantage currently estimated at +0.467 goals/game.

My favorite team is now firmly in the #30 spot (and now without their best defenseman). :scared:
 

Doctor No

Registered User
Oct 26, 2005
9,250
3,971
hockeygoalies.org
NHL games through December 11, 2016:

Team | 2016-17 Goal Diff | 2016-17 Schedule | 2016-17 Strength
Columbus|
1.192​
|
-0.049​
|
1.144​
|
NY Rangers|
1.167​
|
-0.054​
|
1.112​
|
Montreal|
1.036​
|
-0.104​
|
0.932​
|
Pittsburgh|
0.464​
|
0.084​
|
0.548​
|
Minnesota|
0.704​
|
-0.177​
|
0.527​
|
Washington|
0.481​
|
-0.051​
|
0.431​
|
San Jose|
0.250​
|
0.107​
|
0.357​
|
Chicago|
0.367​
|
-0.116​
|
0.250​
|
Anaheim|
0.207​
|
0.032​
|
0.239​
|
Edmonton|
0.258​
|
-0.074​
|
0.185​
|
Philadelphia|
0.226​
|
-0.052​
|
0.174​
|
St. Louis|
0.000​
|
0.079​
|
0.079​
|
Tampa Bay|
0.000​
|
0.053​
|
0.053​
|
Los Angeles|
0.037​
|
0.006​
|
0.043​
|
Boston|
-0.034​
|
0.071​
|
0.037​
|
Carolina|
-0.250​
|
0.199​
|
-0.051​
|
Calgary|
-0.161​
|
0.029​
|
-0.133​
|
Florida|
-0.241​
|
0.078​
|
-0.163​
|
NY Islanders|
-0.370​
|
0.197​
|
-0.173​
|
Toronto|
-0.185​
|
0.007​
|
-0.178​
|
Detroit|
-0.241​
|
0.034​
|
-0.207​
|
Nashville|
0.000​
|
-0.233​
|
-0.233​
|
Ottawa|
-0.276​
|
-0.016​
|
-0.292​
|
New Jersey|
-0.464​
|
0.057​
|
-0.407​
|
Winnipeg|
-0.438​
|
-0.030​
|
-0.468​
|
Buffalo|
-0.593​
|
0.066​
|
-0.526​
|
Vancouver|
-0.655​
|
-0.019​
|
-0.674​
|
Arizona|
-0.778​
|
0.059​
|
-0.719​
|
Dallas|
-0.700​
|
-0.020​
|
-0.720​
|
Colorado|
-0.963​
|
-0.002​
|
-0.965​
|

Home-ice advantage has climbed over the half-goal/game mark once again, and is currently estimated at +0.505 goals/game.
 

Doctor No

Registered User
Oct 26, 2005
9,250
3,971
hockeygoalies.org
NHL games through December 18, 2016:

Team | 2016-17 Goal Diff | 2016-17 Schedule | 2016-17 Strength
Columbus|
1.276​
|
-0.068​
|
1.207​
|
NY Rangers|
1.118​
|
-0.071​
|
1.047​
|
Montreal|
0.871​
|
-0.083​
|
0.788​
|
Minnesota|
0.967​
|
-0.196​
|
0.771​
|
Pittsburgh|
0.594​
|
0.005​
|
0.599​
|
Washington|
0.500​
|
-0.025​
|
0.475​
|
Chicago|
0.529​
|
-0.062​
|
0.467​
|
San Jose|
0.250​
|
0.112​
|
0.362​
|
Edmonton|
0.212​
|
-0.029​
|
0.183​
|
Philadelphia|
0.182​
|
-0.083​
|
0.099​
|
Boston|
-0.030​
|
0.105​
|
0.075​
|
Los Angeles|
0.032​
|
0.039​
|
0.072​
|
Anaheim|
0.031​
|
0.024​
|
0.055​
|
St. Louis|
-0.063​
|
0.094​
|
0.032​
|
Tampa Bay|
0.000​
|
0.004​
|
0.004​
|
Carolina|
-0.161​
|
0.108​
|
-0.053​
|
Ottawa|
-0.094​
|
-0.046​
|
-0.140​
|
Nashville|
-0.033​
|
-0.154​
|
-0.187​
|
Toronto|
-0.200​
|
0.000​
|
-0.200​
|
Calgary|
-0.333​
|
0.085​
|
-0.248​
|
Florida|
-0.313​
|
0.058​
|
-0.254​
|
Winnipeg|
-0.294​
|
-0.051​
|
-0.346​
|
Detroit|
-0.344​
|
-0.022​
|
-0.366​
|
Buffalo|
-0.433​
|
0.049​
|
-0.384​
|
NY Islanders|
-0.581​
|
0.151​
|
-0.430​
|
Dallas|
-0.515​
|
0.022​
|
-0.493​
|
New Jersey|
-0.613​
|
0.112​
|
-0.501​
|
Vancouver|
-0.625​
|
0.004​
|
-0.621​
|
Arizona|
-0.871​
|
0.095​
|
-0.776​
|
Colorado|
-1.067​
|
0.029​
|
-1.038​
|

Home-ice advantage is currently estimated at +0.469 goals/game.

Go Avalanche. :(
 

morehockeystats

Unusual hockey stats
Dec 13, 2016
617
296
Columbus
morehockeystats.com
Just like with the goalies - I have the teams "Elo"ed too:
http://morehockeystats.com/teams/elo
I usually tweet my season-end projections by the end of each week, here's the last one (as of 12/18)
C0BEIbdUcAAwln-.jpg:large

Columbus wrecked some more havoc since, though.
 

Doctor No

Registered User
Oct 26, 2005
9,250
3,971
hockeygoalies.org
Neat! I like the ELO architecture - very cool stuff.

The SRS isn't particularly sophisticated - the main reasons I post it are to get people thinking about these things (and perhaps get involved themselves in predictive analytics), and I also use them concurrently with the other thread (since for goalie strengths of schedules, what I need is more of a concurrent model than a predictive one).
 

Doctor No

Registered User
Oct 26, 2005
9,250
3,971
hockeygoalies.org
NHL games through December 23, 2016:

Team | 2016-17 Goal Diff | 2016-17 Schedule | 2016-17 Strength
Columbus|
1.406​
|
-0.043​
|
1.363​
|
Minnesota|
1.091​
|
-0.162​
|
0.929​
|
Montreal|
0.824​
|
-0.004​
|
0.820​
|
NY Rangers|
0.833​
|
-0.025​
|
0.808​
|
Pittsburgh|
0.600​
|
0.065​
|
0.665​
|
Washington|
0.563​
|
-0.016​
|
0.547​
|
San Jose|
0.353​
|
0.107​
|
0.460​
|
Chicago|
0.444​
|
-0.111​
|
0.333​
|
Edmonton|
0.222​
|
-0.024​
|
0.198​
|
Los Angeles|
0.088​
|
0.084​
|
0.172​
|
Tampa Bay|
0.057​
|
0.004​
|
0.061​
|
Boston|
-0.056​
|
0.089​
|
0.033​
|
Toronto|
0.061​
|
-0.047​
|
0.014​
|
Anaheim|
-0.086​
|
0.092​
|
0.006​
|
Carolina|
-0.061​
|
0.064​
|
0.004​
|
Philadelphia|
0.056​
|
-0.090​
|
-0.035​
|
St. Louis|
-0.143​
|
0.090​
|
-0.053​
|
Ottawa|
-0.029​
|
-0.039​
|
-0.068​
|
Nashville|
0.000​
|
-0.166​
|
-0.166​
|
Calgary|
-0.250​
|
0.046​
|
-0.204​
|
NY Islanders|
-0.364​
|
0.133​
|
-0.231​
|
Florida|
-0.343​
|
0.015​
|
-0.328​
|
Winnipeg|
-0.278​
|
-0.094​
|
-0.371​
|
Detroit|
-0.382​
|
-0.026​
|
-0.409​
|
Dallas|
-0.486​
|
-0.009​
|
-0.494​
|
Buffalo|
-0.606​
|
0.057​
|
-0.549​
|
New Jersey|
-0.647​
|
0.087​
|
-0.560​
|
Vancouver|
-0.657​
|
-0.023​
|
-0.681​
|
Arizona|
-0.971​
|
0.081​
|
-0.890​
|
Colorado|
-1.182​
|
0.081​
|
-1.101​
|

Home ice advantage is currently estimated at +0.460 goals/game.
 

MNNumbers

HFBoards Sponsor
Sponsor
Nov 17, 2011
7,652
2,521

Quick question....

Your current Elo has the Sens with a higher score than the Canadiens, and the Flyers higher than the Rangers. I have no complaints with that.

The interesting thing to me is that, in both case, your end of season projection has the team with the lower Elo finishing above the other.

Can you explain why?

Also, not familiar with Elo and hockey. Do you use only wins, losses, OTL? Is GD part of the calculation?

And, I have done a Bradley-Terry for the NHL before, although not this year, to smooth out the schedule influence as the season plays out. That model needs to use wins and losses. NHL standings, because of OT and SO, do not easily lend themselves to that. Do you find the same with Elo for teams? And, how do you choose to handle the OT and the SO?

Thanks.
 

Daeni10

Kunitz was there
Dec 31, 2013
5,420
1,914
Cologne
Quick question....

Your current Elo has the Sens with a higher score than the Canadiens, and the Flyers higher than the Rangers. I have no complaints with that.

The interesting thing to me is that, in both case, your end of season projection has the team with the lower Elo finishing above the other.

I am not an expert on it either so sorry if I am wrong, but I wanna give it a try at least. :laugh:
The system isnt only based on win and loses, but also on what opponents you played and it also factors in if you played them at home or away. The season projection now looks at the remaning schedule and then calculates the projected finish this season leading to the projected end score. However the calculation can change throughout the season as the Elo of the teams changes too. If you played the Blue Jackets on Day 3 of the season they probably had a lower elo than they have now, so at this point the projection would calculate you playing against them differently than it would now as they won like 14 games in a row I think. This also leads to different Elo gain/loss when you play against them. So I believe that a win now would give you more Elo than it would have if you played them at the 2nd day of the season when they were not as high in the ranking. So while some teams have a lower Elo now, the remaining schedule could be a lot easier so they are projected to win a lot more or they could play way more home games which gives them an advantage in the calculation and stuff.
Now this is based on my other experiences with Elo where you gain/lose Elo for a win/loss and the amount you gain/lose depends on the Elo of the opponents.

Maybe I am totally wrong and I am deeply sorry for wasting your time if I am, but thats the way I thought of it:laugh:
 

Doctor No

Registered User
Oct 26, 2005
9,250
3,971
hockeygoalies.org
That's my bet, too - if only because I follow some NFL ELO rankings pretty closely, and that's what happens quite a bit (higher ranked teams projected to finish lower in the standings - partly because they're already behind in the standings, and partly because they have tougher remaining opponents).
 

morehockeystats

Unusual hockey stats
Dec 13, 2016
617
296
Columbus
morehockeystats.com
Quick question....

Your current Elo has the Sens with a higher score than the Canadiens, and the Flyers higher than the Rangers. I have no complaints with that.

The interesting thing to me is that, in both case, your end of season projection has the team with the lower Elo finishing above the other.

Can you explain why?

Also, not familiar with Elo and hockey. Do you use only wins, losses, OTL? Is GD part of the calculation?

And, I have done a Bradley-Terry for the NHL before, although not this year, to smooth out the schedule influence as the season plays out. That model needs to use wins and losses. NHL standings, because of OT and SO, do not easily lend themselves to that. Do you find the same with Elo for teams? And, how do you choose to handle the OT and the SO?

Thanks.
Thanks for the questions.
The estimate of how the team would finish comes from the sum of current points and the number of projected remaining points. This latter one is a function of the remaining schedule strength, but also of the number of the remaining games to play.

Also a streaking up team may surpass a streaking down team, or even a level team, in Elo before overtaking it in points.

Regarding the OT and the SO:
1) I treat shootout loss as a 'draw', or score of 0.5 pts (because Elo functions work with 0-1 scale), to compare with expected score. Therefore the ratings tend to inflate over season, unlike in chess where the average stays the same. However since I reset the team ratings to 2000 at the start of the season, the inflation is not important - and the Elo itself only cares about difference between ratings, not their actual values.

2) I calculate the share (P) of game ending in OT/SO and it affects the expectation - the expectation is multiplied by P/2 for ALL teams.

I don't use GD.
 

morehockeystats

Unusual hockey stats
Dec 13, 2016
617
296
Columbus
morehockeystats.com
That's my bet, too - if only because I follow some NFL ELO rankings pretty closely, and that's what happens quite a bit (higher ranked teams projected to finish lower in the standings - partly because they're already behind in the standings, and partly because they have tougher remaining opponents).
The number of the remaining games is also quite important, and while in the NFL the disparity of games played rarely gets beyond 1, in the NHL it can be as large as 5-6.
 

morehockeystats

Unusual hockey stats
Dec 13, 2016
617
296
Columbus
morehockeystats.com
I am not an expert on it either so sorry if I am wrong, but I wanna give it a try at least. :laugh:
The system isnt only based on win and loses, but also on what opponents you played and it also factors in if you played them at home or away. The season projection now looks at the remaning schedule and then calculates the projected finish this season leading to the projected end score. However the calculation can change throughout the season as the Elo of the teams changes too. If you played the Blue Jackets on Day 3 of the season they probably had a lower elo than they have now, so at this point the projection would calculate you playing against them differently than it would now as they won like 14 games in a row I think. This also leads to different Elo gain/loss when you play against them. So I believe that a win now would give you more Elo than it would have if you played them at the 2nd day of the season when they were not as high in the ranking. So while some teams have a lower Elo now, the remaining schedule could be a lot easier so they are projected to win a lot more or they could play way more home games which gives them an advantage in the calculation and stuff.
Now this is based on my other experiences with Elo where you gain/lose Elo for a win/loss and the amount you gain/lose depends on the Elo of the opponents.

Maybe I am totally wrong and I am deeply sorry for wasting your time if I am, but thats the way I thought of it:laugh:

Home and away aren't factored into my calculations, just like White and Black are not factored in the chess Elo.

Otherwise you are correct.

You can see the more detailed projection on my website:
http://www.morehockeystats.com/teams/elo
 

Daeni10

Kunitz was there
Dec 31, 2013
5,420
1,914
Cologne
Home and away aren't factored into my calculations, just like White and Black are not factored in the chess Elo.

Otherwise you are correct.

You can see the more detailed projection on my website:
http://www.morehockeystats.com/teams/elo

I dont really follow chess so sorry for the off topic, but isn't there a pretty big difference in winrate between White and Black, like if White plays it perfectly black does not have a chance to win in theory?

I will check your site though, thanks for providing this. It's really interesting :)
 

Ad

Upcoming events

Ad

Ad

-->