Cunneen
Registered User
- May 8, 2013
- 94
- 0
Most people in the advanced hockey metrics community are aware that Blocked shots correlate slightly negatively to winning (in other words, teams with a lot of blocked shots will usually have less wins and a worse goal differential than teams with smaller blocked shot totals). This is because a blocked shot for team A actually shows us that Team A didn't have the puck.
However, I thought it would be interesting to calculate the ratio of blocked shots per total shot attempts. I wanted to do this to determine which teams blocked more shots per shot attempt, which teams got more of their shots blocked per shot attempt, and whether that correlated at all to winning and or scoring goals.
Calculating the percentage of shots a team blocks (compared to their total shot attempts total) or the percentage shots a team took that got blocked is very easy. NOTE: all numbers are courtesy of stats.hockeyanalysis.com and are at even strength (5v5) and not including any situations with the goaltender pulled.
Blocked Shots percentage For = Blocked shots by team/ Corsi against *100
Blocked Shots percentage against= Blocked shots by opposing teams / Corsi For*100
(Corsi is equal to shots on goal + miss shots on goal +blocked shots).
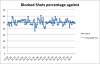
First, I will do Blocked Shots percentage against for the past three seasons. (Look at first attachment for the graph with the results). Remember, this stat shows the rate at which a team's shots get blocked by the opposing team.
On the X axis are the blocked shot percentages against. On the Y axis is the Goals For%.
The R^2 value for this data was .00085. In other words, no correlation at all.
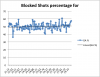
Second, I will do Blocked Shots Percentage For (past three seasons). (second attachment)
Remember, this stat shows the rate at which a team blocks their opponents shots.
On the X axis are the blocked shot percentages against. On the Y axis is the Goals For%.
The R^2 value for this data was .01695, Again, too low to show any correlation between shot blocking rates and goal differential percentage
Conclusions:
From the data it seems to me that shot blocking rates have little effect on goal differential. While past research has determined that the # of shot blocks is usually lower for a better team, the rate at which an individual team either blocks shots or gets their shots blocked compared to total shot attempts against/for seems to be very close to irrelevant.
Any Thoughts??
However, I thought it would be interesting to calculate the ratio of blocked shots per total shot attempts. I wanted to do this to determine which teams blocked more shots per shot attempt, which teams got more of their shots blocked per shot attempt, and whether that correlated at all to winning and or scoring goals.
Calculating the percentage of shots a team blocks (compared to their total shot attempts total) or the percentage shots a team took that got blocked is very easy. NOTE: all numbers are courtesy of stats.hockeyanalysis.com and are at even strength (5v5) and not including any situations with the goaltender pulled.
Blocked Shots percentage For = Blocked shots by team/ Corsi against *100
Blocked Shots percentage against= Blocked shots by opposing teams / Corsi For*100
(Corsi is equal to shots on goal + miss shots on goal +blocked shots).
First, I will do Blocked Shots percentage against for the past three seasons. (Look at first attachment for the graph with the results). Remember, this stat shows the rate at which a team's shots get blocked by the opposing team.
On the X axis are the blocked shot percentages against. On the Y axis is the Goals For%.
The R^2 value for this data was .00085. In other words, no correlation at all.
Second, I will do Blocked Shots Percentage For (past three seasons). (second attachment)
Remember, this stat shows the rate at which a team blocks their opponents shots.
On the X axis are the blocked shot percentages against. On the Y axis is the Goals For%.
The R^2 value for this data was .01695, Again, too low to show any correlation between shot blocking rates and goal differential percentage
Conclusions:
From the data it seems to me that shot blocking rates have little effect on goal differential. While past research has determined that the # of shot blocks is usually lower for a better team, the rate at which an individual team either blocks shots or gets their shots blocked compared to total shot attempts against/for seems to be very close to irrelevant.
Any Thoughts??