Where do you place Ovechkin on your personal list of the greatest players of all time?

Hockey Outsider

Registered User
Jan 16, 2005
9,183
14,574
I don't mean to single you out here, but the rampant misspelling of Paul Coffey's name on the forum lately (mainly in other threads and by other posters) is upsetting me greatly.

Everyone, please note: Paul Coffey, NHL defenceman, has a name distinguishable in spelling from the caffeinated beverage!! Please respect the 'y' in Paul Douglas Coffey's name henceforth!!

Coffee
intro-1645231221.jpg


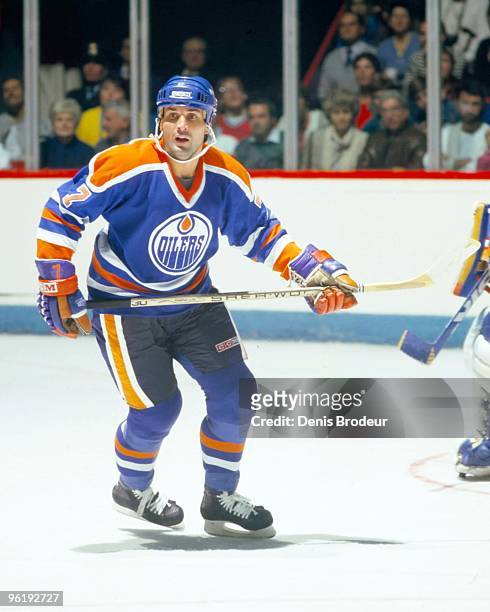
Coffey
paul-coffey-of-the-edmonton-oilers-skates-while-looking-for-the-puck-against-the-montreal.jpg
I still confuse my wife by insisting that Gretzky played with Coffee and Curry. If either of those spilled on a Fuhr coat, it would make things a lot Messier.
 

Neutrinos

Registered User
Sep 23, 2016
8,616
3,614
We have reached a new Lowe...

Hopefully Weir able to bounce back...

I still confuse my wife by insisting that Gretzky played with Coffee and Curry. If either of those spilled on a Fuhr coat, it would make things a lot Messier.


norrisnick

The best...
Apr 14, 2005
29,273
13,831
This argument will always be wrong.

If you want to argue that the NHL is richer and deeper in talent-pool now, mainly due to Europeans and Americans occupying more competition for the top, that is entirely reasonable (and true). But the sheer size of the League is not a factor at all, and should not even be brought up in these discussions.

Let's say the NHL decides tomorrow to reduce itself to 12 teams instead of 32 teams. Does this mean 60% of the best players are now unemployed and will go to the AHL, KHL, etc.? No, it doesn't. The same players who were the 250 best players last season will still be the best 250 players next season, the only difference being that now they'll be spread among only 12 teams instead of 32. So, competition for top-spot for scoring will be just as difficult in a 12-team League as in a 32-team League.
And 1st line ice time and PP minutes now becomes 2nd or 3rd line icetime and no PP for a hefty chunk of players thus limiting the number of players that can reasonably challenge the top positions in scoring. Smaller leagues dramatically condense the production opportunities for top liners and limits the number of players they're competing with. It's not the same top 250 players in both cases. In a 12 team league, you've suddenly only got 36 forwards that are going to get the top opportunities vs 96 in a 32 team league.

'71 and '23 had very similar goals per game (3.12 vs 3.14).

1st in '71 had 152 points. 1st in '23 had 153 points.
6th in '71 had 85 points. 6th in '23 had 109 points.
12th in '71 had 75 points. 12th in '23 had 99 points.
18th in '71 had 68 points. 48th in '23 had 73 points. Half-way point of top liners
36th in '71 had 59 points. 96th in '23 had 59 points. End of the top line.

Obviously some 2nd liners on some teams outscore some 1st liners on others and D muddy things up a bit, but in generalities... Yes, at the very tippy top it's largely the same. But even halfway through the top 10 things get very different in a hurry between the two league sizes. There simply are fewer great players on great teams piling up lots of points in a small league because there are fewer opportunities to do so.
 
  • Like
Reactions: Dennis Bonvie

MadLuke

Registered User
Jan 18, 2011
9,606
5,223
the only difference being that now they'll be spread among only 12 teams instead of 32. So, competition for top-spot for scoring will be just as difficult in a 12-team League as in a 32-team League.
It can have a marginal impact, did the expension made McDavid miss a Top 5 goal finish, would Karlsson score 43 if he stay on the Jacket ?

Maybe St-Louis is out of the league by 26 in a small league and does not steal people Art Ross.

It would specially change little over longer period of time, but should make season top finish noisier, you roll way more 2018 Karlsson shooting 23% and basically scoring 3 time more goals than usual dice and you have to compete with more players peak years that would have not been on the first power play unit.

And obviously some, you have a place in the league as a top offensive forward used as such but would not on a team with a strong top 6 situation.

It will not change who score more points over 3-5 seasons type of things or very rarely late bloomer that maybe would have never bloom St-Louis type of possibility, but yearly top 10-20, I can see it.

Also it will diminishing return, going from 6 to 18-24 teams would be significant, specially if there is playing on a bad team that face good team more often and vice versa, not having to play montreal-detroit 14 time a year because you play for them that big. Going from 18-24 to 32, it will become more marginal, but can still happen.
 

Neutrinos

Registered User
Sep 23, 2016
8,616
3,614
People rank Crosby in the top 10 and he lost Art Ross' to Sedin, Benn during his prime.

You are correct, however, I was talking about points-per-game, not point totals

In Benn's Ross season, Crosby actually lead the league in PPG, and the year Sedin won his Ross, Crosby was just .02 PPG behind

But Crosby also had seasons where he lead the league by .34, .31, and .23 PPG

Even Malkin, Kane, and Kucherov lead the league by at least .20 PPG during their career years

But Ovechkin's highest PPG season only saw him finish .14 PPG ahead of Henrik Sedin
 

Voight

#winning
Feb 8, 2012
40,768
17,138
Mulberry Street
This argument will always be wrong.

If you want to argue that the NHL is richer and deeper in talent-pool now, mainly due to Europeans and Americans occupying more competition for the top, that is entirely reasonable (and true). But the sheer size of the League is not a factor at all, and should not even be brought up in these discussions.

Let's say the NHL decides tomorrow to reduce itself to 12 teams instead of 32 teams. Does this mean 60% of the best players are now unemployed and will go to the AHL, KHL, etc.? No, it doesn't. The same players who were the 250 best players last season will still be the best 250 players next season, the only difference being that now they'll be spread among only 12 teams instead of 32. So, competition for top-spot for scoring will be just as difficult in a 12-team League as in a 32-team League.

Not to mention players would be going against elite talent every game. You wouldnt have any "star-less" teams to rack up points against.
 

Victorias

Registered User
May 1, 2022
341
584
You are correct, however, I was talking about points-per-game, not point totals

In Benn's Ross season, Crosby actually lead the league in PPG, and the year Sedin won his Ross, Crosby was just .02 PPG behind

But Crosby also had seasons where he lead the league by .34, .31, and .23 PPG

Even Malkin, Kane, and Kucherov lead the league by at least .20 PPG during their career years

But Ovechkin's highest PPG season only saw him finish .14 PPG ahead of Henrik Sedin
This might be the best example of why you need to look beyond points and PPG. Points will always favor playmakers over goalscorers because assists occur 1.5x as often as goals.

Malkin, Kane, Kucherov, and Sedin never led the league in goals while Ovechkin’s 65 in his Ross season has still not been topped in the Cap era despite scoring increasing.

Finally, he had the same number of points at even strength that year (75) as McDavid did in 22-23. So he wasn’t just burying PP one-timers.
 
Last edited:

MadLuke

Registered User
Jan 18, 2011
9,606
5,223
Ovechkin durability is part of what made him great, but even when looking at PPG that could be minimizing it a bit.

Sedin was playing with is 1.35ppg twin self during their peak season are those 2 at their very peak on the same line, with a nice match third winger on a nice team not really hard to beat ?, .16 ppg ahead of prime Crosby sound better:

Points Per Game
1.Alex Ovechkin • WSH1.51
2.Henrik Sedin* • VAN1.37
3.Daniel Sedin* • VAN1.35
4.Sidney Crosby • PIT1.35

During those 3 season

Ovechkin: 1.42 ppg
Crosby: 1.35ppg
Malkin: 1.28 ppg
...........
rest of the league jammed between 1 and 1.13 ppg

That was 33% higher than the number 10, the last 3 years Drai has been scoring a bit like it was 1985 and he was 26% ahead of the number 10, it is not an over 40% like Crosby-Jagr-level but for a goalscoring machine, depending of higher one value a goal, probably a similar ball park
 

Nathaniel Skywalker

Registered User
Oct 18, 2013
13,844
5,413
Ovechkin durability is part of what made him great, but even when looking at PPG that could be minimizing it a bit.

Sedin was playing with is 1.35ppg twin self during their peak season are those 2 at their very peak on the same line, with a nice match third winger on a nice team not really hard to beat ?, .16 ppg ahead of prime Crosby sound better:

Points Per Game
1.Alex Ovechkin • WSH1.51
2.Henrik Sedin* • VAN1.37
3.Daniel Sedin* • VAN1.35
4.Sidney Crosby • PIT1.35

During those 3 season

Ovechkin: 1.42 ppg
Crosby: 1.35ppg
Malkin: 1.28 ppg
...........
rest of the league jammed between 1 and 1.13 ppg

That was 33% higher than the number 10, the last 3 years Drai has been scoring a bit like it was 1985 and he was 26% ahead of the number 10, it is not an over 40% like Crosby-Jagr-level but for a goalscoring machine, depending of higher one value a goal, probably a similar ball park
The problem with that is even during ovechkins big 3 year peak Crosby was still a dominant top 3 player in the league and after that has consistently been the better player.
 

Vilica

Registered User
Jun 1, 2014
442
500
Hull and Mikita weren't linemates.

Hull was a superior point producer year over year.

Hull: 1,1,1,2,2,2,4,5,6,7,9
Ovechkin: 1,2,3,3,4,5,7,10

Remove same finishes
Hull:1,1,2,2,6,9
Ovechkin: 3,3,10

We can point to different league size, but it's a fairly clear point gap.

I also think Hull gets underrated as a playoff performer. Watching a bunch of 60s Hawks games, the gap between Hull and Mikita in meaningful games is pretty big.

Both are in that 2-5 winger group, but I tend to go Hull, Jagr, Ovechkin, Richard.

Trying to compare point production across eras without even thinking about league size is just ignoring basic statistics. Here's a table of Hull's point ranks converted to the first 15 years of Ovechkin's career, and vice-versa, as if they had the exact same year [ie in 57-58, Hull scored 8% of Chicago's goals and had a point on 28.8% (line of 13+34=47), as Chicago scored 163 goals with a league average of 196 (83.2% of league average). That same year in 05-06, where league average was 248, would correspond to 206 team goals scored, and a line of 16+43=59, tied in 80th place with Pierre-Marc Bouchard, Kyle Calder, Erik Cole, Tomas Holmstrom, Daymond Langkow, Mathieu Schneider, and Marco Sturm. In 05-06, Ovechkin scored 22.6% of the Capitals goals and had a point on 46.1% (line of 52+54=106), as Washington scored 230 goals with a league average of 248 (92.7% of league average). In 57-58, that would correspond to 182 team goals, and a line of 41+43=84, tying Dickie Moore for 1st in scoring.]

Hull Pts Rank [O6]YearYearHull Pts Rank [Now]Ovi Pts Rank [Now]YearYearOvi Pts Rank [O6]
2057-5805-0680305-0657-581
2158-5906-07851306-0758-594
159-6007-0810107-0859-601
1360-6108-0955208-0960-611
161-6209-108209-1061-621
962-6310-1128710-1162-633
263-6411-1223711-1263-6413
464-6512-1320312-1364-651
165-6613-142813-1465-664
266-6714-154414-1566-673
667-6815-1661515-1667-6812
268-6916-1712016-1768-6915
1569-7017-18311117-1869-704
570-7118-19101518-1970-716
771-7219-2091819-2071-7213

If you remove duplicates, you end up with the following for Hull in the modern era:
Ovechkin - 3 3 7 11 13 15 15 18 37
Hull - 6 9 10 10 28 31 55 80 85

For Hull's era, removing duplicates, you end up with the following:

Ovechkin - 1 1 3 3 4 4 12 13
Hull - 2 2 2 5 7 9 20 21

Hull ends up with an extra top 10 appearance in the modern era, but I think Ovechkin is fairly clearly ahead in point finishes in both eras.
 

daver

Registered User
Apr 4, 2003
25,997
5,854
Visit site
Trying to compare point production across eras without even thinking about league size is just ignoring basic statistics. Here's a table of Hull's point ranks converted to the first 15 years of Ovechkin's career, and vice-versa, as if they had the exact same year [ie in 57-58, Hull scored 8% of Chicago's goals and had a point on 28.8% (line of 13+34=47), as Chicago scored 163 goals with a league average of 196 (83.2% of league average). That same year in 05-06, where league average was 248, would correspond to 206 team goals scored, and a line of 16+43=59, tied in 80th place with Pierre-Marc Bouchard, Kyle Calder, Erik Cole, Tomas Holmstrom, Daymond Langkow, Mathieu Schneider, and Marco Sturm. In 05-06, Ovechkin scored 22.6% of the Capitals goals and had a point on 46.1% (line of 52+54=106), as Washington scored 230 goals with a league average of 248 (92.7% of league average). In 57-58, that would correspond to 182 team goals, and a line of 41+43=84, tying Dickie Moore for 1st in scoring.]

Hull Pts Rank [O6]YearYearHull Pts Rank [Now]Ovi Pts Rank [Now]YearYearOvi Pts Rank [O6]
2057-5805-0680305-0657-581
2158-5906-07851306-0758-594
159-6007-0810107-0859-601
1360-6108-0955208-0960-611
161-6209-108209-1061-621
962-6310-1128710-1162-633
263-6411-1223711-1263-6413
464-6512-1320312-1364-651
165-6613-142813-1465-664
266-6714-154414-1566-673
667-6815-1661515-1667-6812
268-6916-1712016-1768-6915
1569-7017-18311117-1869-704
570-7118-19101518-1970-716
771-7219-2091819-2071-7213

If you remove duplicates, you end up with the following for Hull in the modern era:
Ovechkin - 3 3 7 11 13 15 15 18 37
Hull - 6 9 10 10 28 31 55 80 85

For Hull's era, removing duplicates, you end up with the following:

Ovechkin - 1 1 3 3 4 4 12 13
Hull - 2 2 2 5 7 9 20 21

Hull ends up with an extra top 10 appearance in the modern era, but I think Ovechkin is fairly clearly ahead in point finishes in both eras.

League size can serve as a tiebreaker for players with similar stats but it gets unreasonable when you move players up statistically. It doesn't pass the smell test.

It boils down to this: Ovechkin would be closer to Bobby Hull all-time if had more seasons where he was at a "Bobby Hull" level instead of "Brett Hull/Andreychuk" level.

And if any Top 20 player is going to get dinged for being given the greenlight to cheat on the defensive side OV and Jagr are at the top of the list.
 

Despote

Registered User
Mar 21, 2023
1,233
2,575
And if any Top 20 player is going to get dinged for being given the greenlight to cheat on the defensive side OV and Jagr are at the top of the list.
Why would Jagr count here? There's no evidence that he was a poor defensive player, in fact his defensive impact was very good well into his 40s due to his dominant puck-possession style.
 

MadLuke

Registered User
Jan 18, 2011
9,606
5,223
Trying to compare point production across eras without even thinking about league size is just ignoring basic statistics. Here's a table of Hull's point ranks converted to the first 15 years of Ovechkin's career, and vice-versa, as if they had the exact same year [ie in 57-58, Hull scored 8% of Chicago's goals and had a point on 28.8% (line of 13+34=47), as Chicago scored 163 goals with a league average of 196 (83.2% of league average). That same year in 05-06, where league average was 248, would correspond to 206 team goals scored, and a line of 16+43=59
I must admit I do not understand, for example I do not even see where what is done with thinking about league size here, what if there were 40 teams in 05-06 what do we change ?

I think the least controversial thing we can do when comparing result around time (and there never anything definitivie just a tool), is to look result against the Canadian elite of their respective eras.

I did try to do it (and adjust a little bit using Canadian male hockey population size to augment or diminish how low you, you many of the top Canadian you pick to calculate the average output on an elite canadian offensive player, adjusted to never go above the number of first liner in the league at the peak of the 06 talent pool).

Back in 2021 (I imagine Ovechkin would not have added peak season since), it gave me something like this for the best 6 career adjusted points (82 games season adjusted) in the league history, to note playing most of the game in your peak here help a lot, size length get adjusted but if you missed game you also miss a pro-rated amount of the virtual season:

Top 6 season (not in a row)
fullNameBestSeasonsPoints
Wayne Gretzky1216
Mario Lemieux993
Jaromir Jagr942
Phil Esposito915
Gordie Howe902
Bobby Orr838
Connor McDavid838
Sidney Crosby811
Guy Lafleur807
Stan Mikita802
Joe Sakic793
Marcel Dionne792
Patrick Kane789
Alex Ovechkin788
Teemu Selanne784
Bobby Hull783
Joe Thornton776
Evgeni Malkin771
Jean Beliveau769
Peter Forsberg769

Top 10 season:
ullNameBestSeasonsPoints
Wayne Gretzky1870
Mario Lemieux1495
Jaromir Jagr1422
Gordie Howe1399
Phil Esposito1358
Sidney Crosby1294
Joe Sakic1236
Stan Mikita1234
Alex Ovechkin1229
Bobby Hull1221
Teemu Selanne1205
Marcel Dionne1201
Joe Thornton1198
Patrick Kane1196
Jean Beliveau1189
Steve Yzerman1171
Evgeni Malkin1170
Maurice Richard1161
Mike Bossy1139
Martin St. Louis1137

Hull Ovechkin at a tie (not just because it is me doing it and I am not confident in my code, database, logic, I would not take +/- 3% type difference has not a tie, but here it is just the same adjusted points, to some small decimal per game).

Hull did this during his 21-33 prime:


Ovechkin from 22 to 33

Performed relative to the top Canadians in a very similar fashion (single one with a better ppg, much larger gap but Crosby > Esposito and Ovechkin did more in the nhl outside that window than Hull did obviously)
 
Last edited:

Michael Farkas

Celebrate 68
Jun 28, 2006
13,526
8,143
NYC
www.hockeyprospect.com
Points will always favor playmakers over goalscorers because assists occur 1.5x as often as goals.
Points favor players that produce points. More balanced attackers tend to end up with more points.

That's why pure playmakers/no interest in finishing guys like Mike Ribeiro, Adam Oates (outside of the years where he actually contributed 25 goals), hell, even the guy used as a counterpoint - Nicklas Backstrom - has six top-3 finishes in assists, and, what, one top-5 points finish? And it's the one year he got over 25 goals.

I'm not saying that there isn't more assists than goals or anything silly like that. But points favor guys that can put them up. If anything, I predict we'd see a bigger discrepancy between pure goal scorers and more balanced attackers if the league reverted back to generally not awarding assists from missed shots or even rebounds.
 

Dennis Bonvie

Registered User
Dec 29, 2007
29,622
18,159
Connecticut
I don't think Ovechkin's style of play is actually that unique. Maybe the young-Ovi's physicality mixed with goal-scoring was a bit unique, but even then there were plenty of "power forward" precedents. Ovechkin's style (young or old Ovi, or both) isn't that far removed from:
- Maurice Richard
- Bobby Hull
- Brett Hull

Then, in terms of somewhat or much "lesser" players, he also isn't that distinctive in style from:
- Mike Gartner
- Pat Verbeek
- Cam Neely
- Luc Robitaille
- Brendan Shanahan
- Jeremy Roenick
- Teemu Selänne
- Ilya Kovalchuk
Etc.

However, what is unique about Ovechkin -- and he shares this with M. Richard and Hull Jr. somewhat, and most certainly with Bobby Hull -- is how League-dominant he has been besides just being far and away the best goal-scorer.

Specifically, Ovechkin has an Art Ross, three Hart trophies, and three Pearsons. That's excessively rare for any Hal of Famer (esp. winger) deemed as "shoot-first" type of player. Richard and Hull Jr. never won an Art Ross. Mike Bossy had zero Ross, Hart, or Pearson.

To put it another way, Ovechkin around 2005 to 2010 was like Maurice Richard or Brett Hull on steroids.

Really, it will always be Bobby Hull who is the best comparable. There are a lot of similarities.

Can't really see how Brett Hull's style compares to Ovie at all.

Never thought of him as a power forward.
 
  • Like
Reactions: Voight

BigBadBruins7708

Registered User
Dec 11, 2017
13,755
18,688
Las Vegas
I must admit I do not understand, for example I do not even see where what is done his thinking about league size here, what if there was 40 teams in 05-06 what do we change ?

I think the least controversial thing we can do when comparing result around time (and there never anything definitivie just a tool), is to look result against the Canadian elite of their respective eras.

I did try to do it (and adjust a little bit using Canadian male hockey population size to augment or diminish how low you, you many of the top Canadian you pick to calculate the average output on an elite canadian offensive player, adjusted to never go above the number of first liner in the league at the peak of the 06 talent pool).

Back in 2021 (I imagine Ovechkin would not have added peak season since), it gave me something like this for the best 6 career adjusted points (82 games season adjusted) in the league history, to note playing most of the game in your peak here help a lot, size length get adjusted but if you missed game you also miss a pro-rated amount of the virtual season:

Top 6 season (not in a row)
fullNameBestSeasonsPoints
Wayne Gretzky1216
Mario Lemieux993
Jaromir Jagr942
Phil Esposito915
Gordie Howe902
Bobby Orr838
Connor McDavid838
Sidney Crosby811
Guy Lafleur807
Stan Mikita802
Joe Sakic793
Marcel Dionne792
Patrick Kane789
Alex Ovechkin788
Teemu Selanne784
Bobby Hull783
Joe Thornton776
Evgeni Malkin771
Jean Beliveau769
Peter Forsberg769

Top 10 season:
ullNameBestSeasonsPoints
Wayne Gretzky1870
Mario Lemieux1495
Jaromir Jagr1422
Gordie Howe1399
Phil Esposito1358
Sidney Crosby1294
Joe Sakic1236
Stan Mikita1234
Alex Ovechkin1229
Bobby Hull1221
Teemu Selanne1205
Marcel Dionne1201
Joe Thornton1198
Patrick Kane1196
Jean Beliveau1189
Steve Yzerman1171
Evgeni Malkin1170
Maurice Richard1161
Mike Bossy1139
Martin St. Louis1137

Hull Ovechkin at a tie (not just because it is me doing it and I am not confident in my code, database, logic, I would not take +/- 3% type difference has not a tie, but here it is just the same adjusted points, to some small decimal per game).

Hull did this during his 21-33 prime:


Ovechkin from 22 to 33

Performed relative to the top Canadians in a very similar fashion (single one with a better ppg, much larger gap but Crosby > Esposito and Ovechkin did more in the nhl outside that window than Hull did obviously)

Ironically enough, aside from the main point of your post it really makes the case for Jagr and Espo to be above him
 

Vilica

Registered User
Jun 1, 2014
442
500
I must admit I do not understand, for example I do not even see where what is done his thinking about league size here, what if there was 40 teams in 05-06 what do we change ?

I think the least controversial thing we can do when comparing result around time (and there never anything definitivie just a tool), is to look result against the Canadian elite of their respective eras.

The biggest thing that a larger league enables is to ensure the VsX score is more accurate. More opportunities means that it is more likely a player has an outlier season. Other than that, a season is a season is a season. The only reason the points rank comparison vaguely works is because most of the time we're only looking at the top 5% of players. The more talent argument breaks if you even look at players outside the top 50 [in scoring]. We also have the overexpansion of the 70s to help us understand that - professional hockey went from 6 teams to 28 teams in 6 years, and got up to 32 teams by 8, and the result was the biggest gap between haves and have-nots since WW2. There were not enough players to fill out 32 teams, and hockey contracted back to 21 teams by 1980. Hockey is back up to 32 teams now, and the gap between the haves and have-nots is not nearly as pronounced.

Also, my methods make it trivial to compare eras, because the numbers have not changed. Let me give you an example - here are prime years from 6 goal-scoring wingers throughout NHL history. I have anonymized it for now, but I have taken 6 of each winger's prime years (consecutive years, no skipping), randomized the order of the seasons (so if the seasons were 17-18, 18-19, 19-20, 20-21, 21-22, 22-23, they might appear in 21-22, 18-19, 19-20, 17-18, 22-23, 20-21 order), and placed them into this table [so the 6 seasons belonging to player 1 are below P1 LA%, the 6 seasons belonging to player 4 are below P4 LA%, and so on. LA% represents the number of goals their team scored as a percentage of league average, G% represents the percentage of goals the player scored of their teams, P% represents their points percentage. For example, if a team scored 100 goals, when league average was 100, and a player scored 20 and had a point on 40 (a line of 20+20=40), that would be represented here by 100.0%, 20.0%, 40.0%.]:

P1 LA%G%P%P2 LA%G%P%P3 LA%G%P%
100.0%18.1%32.7%137.9%16.0%34.8%92.7%20.4%42.4%
115.6%19.2%33.5%100.0%17.4%29.8%111.4%17.4%31.7%
126.5%15.9%27.2%114.5%20.9%41.0%94.3%15.7%28.3%
127.9%19.3%35.2%106.7%27.3%47.1%112.4%19.7%39.9%
97.7%19.9%39.1%97.8%14.6%38.8%102.8%23.0%38.7%
119.9%16.6%38.2%115.0%21.9%38.4%93.3%16.0%32.0%
P4 LA%G%P%P5 LA%G%P%P6 LA%G%P%
92.5%19.1%35.8%99.5%23.8%37.6%129.8%22.9%36.3%
100.0%24.4%38.3%83.5%19.0%36.1%112.4%26.3%36.4%
112.3%27.7%42.3%90.1%25.0%37.8%121.2%18.3%30.2%
124.5%16.3%28.1%103.0%15.7%28.5%150.0%18.4%29.9%
99.3%21.1%35.9%93.3%13.2%25.0%109.2%11.8%27.7%
100.4%25.1%39.1%123.9%21.9%32.0%129.2%21.9%31.0%

Those 36 seasons represent Charlie Conacher, Maurice Richard, Bobby Hull, Mike Bossy, Brett Hull, and Alex Ovechkin. Can you match the seasons to the player? Look at how similar the seasons are when they are converted to just percentages of team goals.
 

MadLuke

Registered User
Jan 18, 2011
9,606
5,223
LA% represents the number of goals their team scored as a percentage of league average, G% represents the percentage of goals the player scored of their teams, P% represents their points percentage. For example, if a team scored 100 goals, when league average was 100, and a player scored 20 and had a point on 40 (a line of 20+20=40), that would be represented here by 100.0%, 20.0%, 40.0%.]:
That seem really similar to Hockey Reference iirc and seem to have the same issue of not taken into account scoring distribution, if you have a powerplay heavy era first line winger will have a larger proportion of their team goals than in a lower Powerplay era, era when defenceman did not score goal will boost winger goal proportion and so on.

I could be really what does this method do about taking league size into account ? Is the average team goal for that do it ? Does league size change this in a interesting way, I guess scoring goes up but it does for everybody anyway.

To give an example of scoring distribution.

05-06 had 5.85 ppo in average and 1.03 power play goal a game by team, in 98-99 it was 4.38 and 0.69

Jagr scored 54 of the Rangers 250 goals in 06, 21.6%, having 24 pp goals.
In 99 Jagr scored 44 of the pens 242 goals, 18.2% with just 10 pp goals, but with 3 more goal at even strength.

It also it seem give weight for stuff that happen (or not happen) when the player is not on the ice.

Bure in 01 score 59 of the terrible Panthers 200 goals, 29.5%
the year before Bure scored 58 of the Panthers 244 goals, 23.77%

He get a 25% jump for a very similar performance just because the team got worst.

Gretzky when he scored 92 was 22% of the Oilers, does that match we cannot say if 06 Jagr was more or less impressive than Gretzky 92 goal season, does it not overhurt Gretzky to have 50 goals scorer on the second line ? A d like Coffey scoring a lot of goals ?

Also if we go back in time, there was an era with no only not much defenceman scoring goal but less forward on a team, making using the percentage of the goal scored by a player more suspicious, hockey reference over correct this, but here I do not see an attempt.
 

Vilica

Registered User
Jun 1, 2014
442
500
That seem really similar to Hockey Reference iirc and seem to have the same issue of not taken into account scoring distribution, if you have a powerplay heavy era first line winger will have a larger proportion of their team goals than in a lower Powerplay era, era when defenceman did not score goal will boost winger goal proportion and so on.

I could be really what does this method do about taking league size into account ? Is the average team goal for that do it ? Does league size change this in a interesting way, I guess scoring goes up but it does for everybody anyway.

To give an example of scoring distribution.

05-06 had 5.85 ppo in average and 1.03 power play goal a game by team, in 98-99 it was 4.38 and 0.69

Jagr scored 54 of the Rangers 250 goals in 06, 21.6%, having 24 pp goals.
In 99 Jagr scored 44 of the pens 242 goals, 18.2% with just 10 pp goals, but with 3 more goal at even strength.

It also it seem give weight for stuff that happen (or not happen) when the player is not on the ice.

Bure in 01 score 59 of the terrible Panthers 200 goals, 29.5%
the year before Bure scored 58 of the Panthers 244 goals, 23.77%

He get a 25% jump for a very similar performance just because the team got worst.

Gretzky when he scored 92 was 22% of the Oilers, does that match we cannot say if 06 Jagr was more or less impressive than Gretzky 92 goal season, does it not overhurt Gretzky to have 50 goals scorer on the second line ? A d like Coffey scoring a lot of goals ?

Also if we go back in time, there was an era with no only not much defenceman scoring goal but less forward on a team, making using the percentage of the goal scored by a player more suspicious, hockey reference over correct this, but here I do not see an attempt.

Sure, scoring distribution changes a bit, but the year-to-year differences are more due to randomness among seasons than they are to any fundamental change in scoring distribution across eras. If a player's team is not scoring while they're off-ice, that means their G% and P% will be higher, but their LA% will be below-average. The more goals a team scores where a player doesn't get a point, the higher they are in LA%, but the lower in G% and P%. Power plays are higher, power plays are lower, opponents are weaker, team is stronger, a player's IPP% is higher one year, their on-ice shooting percentage is lower one year, in my opinion it all washes out after looking at player-season after player-season. [Although I agree trying to finagle defensemen by points is not a great usage of this - forwards only.]

League average scoring is the main driver of point totals. My spreadsheet was built to funnel everything to Average VsX, which is my version of VsX, so expressing everything in percentages moves everything around league average really easily. Here's the top of my Average VsX list:

RankPts RankNameYearTeamGamesGoalsAssistsPointsTeam GFLA GF% LAG%P%VsXVsX SeasonAvg VsX
11Wayne Gretzky85-86EDM80521632154263171.3440.1220.505141152.48154.72
31Mario Lemieux88-89PIT76851141993472991.1610.2450.573139143.17151.82
41Wayne Gretzky81-82EDM80921202124173211.2990.2210.508147144.22150.66
61Connor McDavid20-21EDM5633721051831651.1090.1800.57469152.17145.17
91Phil Esposito70-71BOS7876761523992441.6350.1900.38190168.89142.11
111Howie Morenz27-28MTL43331851116841.3810.2840.44035145.71138.50
131Jaromir Jagr98-99PIT8144831272422161.1200.1820.525107118.69134.12
162Bobby Orr70-71BOS78371021393992441.6350.0930.34890154.44129.95
181Gordie Howe52-53DET704946952221681.3210.2210.42861155.74128.99
201Cooney Weiland29-30BOS444330731791301.3770.2400.40862117.74128.10
211Joe Malone17-18MTL2044448115861.3370.3830.41746104.35127.32

You'll notice peak years all have similar G% and P%, and they're all way above average in league scoring. Those BOS 70-71 seasons are the outliers, because those are 'ordinary' seasons, but Boston was 63.5% higher than league average that year. Even then, Average VsX is ascribing more precision than is actually calculable. I'd treat 154.72 and 151.83 and 150.66 as essentially the same type of season. There are 4 seasons above 150, 10 above 140, 15 above 130, 28 above 120, 66 above 110, and 167 above 100 in this list. [and the gaps in the overall rankings above are duplicate seasons by players already named.]

Also, similar to my last thread where I talked about a lack of actual player-seasons, the numbers for forwards are around 3200 player-seasons prior to expansion, and about 17000 player-seasons since (10000 pre-lockout, 7000 since the lockout). Pre-expansion seasons make up 4 of the top 21, 5 of the top 26, 11 of the top 50, 23 of the top 100, and 40 of the top 150.

I should probably build a version that does this for goals and assists instead of points, but that's for another day.
 

MadLuke

Registered User
Jan 18, 2011
9,606
5,223
Sure, scoring distribution changes a bit, but the year-to-year differences are more due to randomness among seasons than they are to any fundamental change in scoring distribution across era
I mean to take an extreme example:

Joe Malone scoring 30 of the teams 92 goals, could have something to do with the roster being much smaller, maybe it all balance out by the end I do not see an issue with your end result, my brain just do not understand what going on.

Roster size, 3x3 overtime, 2 assist by goal vs 1 rules, defenceman offensive contribution, power play vs non power play scoring distribution seem all factor that will not be at or purely random, change era to era and will fundamentally change the scoring distribution, maybe not a lot but certainly.

What for goals do you think it would look like for Bure 00 vs 01, does it make a significant swing instead of a very small one ?, look like a good litmus test.
 
Last edited:
  • Like
Reactions: seventieslord

Vilica

Registered User
Jun 1, 2014
442
500
I mean to take an extreme example:

Joe Malone scoring 30 of the teams 92 goals, could have something to do with the roster being much smaller, maybe it all balance out by the end I do not see an issue with your end result, my brain just do not understand what going on.

Roster size, 3x3 overtime, 2 assist by goal vs 1 rules, defenceman offensive contribution, power play vs non power play scoring distribution seem 3 factor that will not be random, change era to era and will fundamentally change the scoring distribution, maybe not a lot but certainly.

What for goals do you think it would look like for Bure 00 vs 01, does it make a significant swing instead of a very small one, look like a good litmus test.
With old seasons (pre-consolidation), essentially the lack of assists given to goals papers over the extra percentage they have of team goals. If you convert Joe Malone's 1917-18 season to an 2005-06 line, it comes out as 127 goals, 11 assists, 138 points. His 20-21 line is 68 goals, 22 assists, 90 points. The balance between goals/assists is way off, but the point totals I think are broadly correct. That's why I invite you to guess that P1-P6 comparison - match each player to their 6 season sample. Without sitting down and figuring out individual seasons, there's not enough differentiating the players to know which is which at a glance, and that's over 80 years of hockey.

Returning to Pavel Bure, here's his best seasons:

Pts RankNameYearTeamGamesGoalsAssistsPointsTeam GFLA GF% LAG%P%VsXVsX SeasonAvg VsX
13Pavel Bure92-93VAN8360501103463051.1340.1730.31814874.3282.27
5Pavel Bure93-94VAN7660471072792721.0260.2150.38412089.1789.74
3Pavel Bure97-98VAN825139902242161.0370.2280.4029198.9095.05
2Pavel Bure99-00FLA745836942442251.0840.2380.38594100.0095.30
7Pavel Bure00-01FLA825933922002260.8850.2950.4609695.8392.86

95.30 is higher than 92.86, and there's about 50 seasons between them on the overall leaderboard, but in the end they're about the same level. We are kinda talking at cross-purposes though because you're concentrating on goals, whereas Average VsX is built to look at points.
 

Midnight Judges

HFBoards Sponsor
Sponsor
Feb 10, 2010
13,641
10,273
Points favor players that produce points. More balanced attackers tend to end up with more points.

That's why pure playmakers/no interest in finishing guys like Mike Ribeiro, Adam Oates (outside of the years where he actually contributed 25 goals), hell, even the guy used as a counterpoint - Nicklas Backstrom - has six top-3 finishes in assists, and, what, one top-5 points finish? And it's the one year he got over 25 goals.

I'm not saying that there isn't more assists than goals or anything silly like that. But points favor guys that can put them up. If anything, I predict we'd see a bigger discrepancy between pure goal scorers and more balanced attackers if the league reverted back to generally not awarding assists from missed shots or even rebounds.

The fact that there are 1.72 assists for every goal is inextricable from the result that accumulating assists is easier than accumulating goals. We can show this many different ways:

Records:

Most career assists vs goals: 1963 vs 894 (2.2 ratio)
Most assists in a season vs most goals: 163 vs 92 (1.77 ratio)
Highest career APG vs GPG: 1.32 vs .76 (1.74 ratio)
Highest APG season vs GPG season: 2.04 vs 1.18 (1.73)

^^^These ratios aren't anomalous.

The highest assists vs highest goals in virtually any given season is going to validate this over and over again.

It shows that goals are harder to accumulate. So if a player's primary role is to score goals, their point totals are going to be lower - at the same caliber of player - than if their primary role is to pass the puck. In terms of offense, the dedicated goal scorer is playing a more difficult role on a per point basis.
 
Last edited:

Ad

Upcoming events

Ad

Ad