
Gil Fisher
Registered User
No. I'm interested in the last column. It stands out.
small sample sv%?
No. I'm interested in the last column. It stands out.
small sample sv%?
small sample data that continues the well-established large sample trend of giving up a lopsided amount of high% shots that doesn't manifest itself in the CF% column. The skater table was just to demonstrate that it's not the fault of a single underperforming defenseman. It's a systemic issue.
(xSV% = 1 - xGA/SA)
All Situations
[table="head;]xSV%|13-14|14-15|15-16|16-17
ANA|0.904|0.909|0.909|0.906
ARI|0.909|0.910|0.914|0.901
BOS|0.920|0.920|0.919|0.912
BUF|0.913|0.913|0.916|0.912
CAR|0.907|0.904|0.902|0.910
CBJ|0.921|0.914|0.907|0.895
CHI|0.912|0.914|0.912|0.908
COL|0.912|0.911|0.911|0.924
DAL|0.903|0.907|0.903|0.905
DET|0.914|0.914|0.911|0.915
EDM|0.907|0.904|0.909|0.902
FLA|0.913|0.916|0.915|0.923
LAK|0.906|0.911|0.906|0.910
MIN|0.915|0.920|0.916|0.924
MTL|0.909|0.909|0.910|0.910
NJD|0.913|0.912|0.909|0.914
NSH|0.920|0.917|0.917|0.913
NYI|0.901|0.903|0.908|0.901
NYR|0.906|0.909|0.902|0.912
OTT|0.914|0.917|0.914|0.922
PHI|0.917|0.912|0.911|0.904
PIT|0.913|0.910|0.917|0.909
SJS|0.916|0.912|0.913|0.904
STL|0.912|0.913|0.909|0.902
TBL|0.914|0.913|0.920|0.919
TOR|0.915|0.910|0.917|0.904
VAN|0.909|0.908|0.911|0.900
WPG|0.903|0.903|0.903|0.900
WSH|0.915|0.913|0.910|0.909[/table]
5v5
[table="head;]xSV%|13-14|14-15|15-16|16-17
ANA|0.913|0.917|0.916|0.923
ARI|0.917|0.918|0.921|0.908
BOS|0.928|0.927|0.925|0.922
BUF|0.920|0.919|0.924|0.922
CAR|0.913|0.910|0.908|0.922
CBJ|0.929|0.921|0.914|0.906
CHI|0.920|0.919|0.919|0.917
COL|0.918|0.918|0.919|0.929
DAL|0.911|0.915|0.911|0.916
DET|0.924|0.922|0.918|0.927
EDM|0.915|0.909|0.917|0.913
FLA|0.920|0.922|0.921|0.931
LAK|0.915|0.918|0.917|0.916
MIN|0.924|0.927|0.923|0.930
MTL|0.917|0.917|0.920|0.921
NJD|0.924|0.921|0.919|0.928
NSH|0.928|0.927|0.924|0.921
NYI|0.909|0.911|0.913|0.911
NYR|0.913|0.914|0.909|0.916
OTT|0.921|0.925|0.921|0.927
PHI|0.925|0.920|0.921|0.911
PIT|0.921|0.918|0.925|0.919
SJS|0.922|0.919|0.921|0.911
STL|0.921|0.919|0.918|0.908
TBL|0.920|0.920|0.926|0.925
TOR|0.921|0.917|0.925|0.911
VAN|0.917|0.915|0.917|0.904
WPG|0.913|0.914|0.912|0.905
WSH|0.922|0.922|0.918|0.918[/table]
looks like a goalie graveyard around here.
but don't mind this. keep discussing Hellebuyck's sv% and Flaherty's performance.
small sample data that continues the well-established large sample trend of giving up a lopsided amount of high% shots that doesn't manifest itself in the CF% column. The skater table was just to demonstrate that it's not the fault of a single underperforming defenseman. It's a systemic issue.
(xSV% = 1 - xGA/SA)
All Situations
[table="head;]xSV%|13-14|14-15|15-16|16-17
WPG|0.903|0.903|0.903|0.900
[/table]
5v5
[table="head;]xSV%|13-14|14-15|15-16|16-17
WPG|0.913|0.914|0.912|0.905
[/table]
looks like a goalie graveyard around here.
but don't mind this. keep discussing Hellebuyck's sv% and Flaherty's performance.
Would someone mind giving me a quick rundown of of xG is calculated?
Or if you don't want to waste words: Am I on the right track to say that it's just shots weighted by the league average SH%/SV% from that particular location? (EDIT: Also assuming that it's adjusted for 5v5, 5v4, 4v5, etc.)
Depends on which expected goal model you are using. There are many, and some are as old as 2007-08. Expected goal model is just a term used for trying to predict in sample goals of shots (although MacDonald once used the term for making a weighted Corsi in predicting future goals).
The xG being used above is Manny's from Corsica. They essentially use shot location, with some added information in trying to estimate rebound, cycle, and rush shots.
xGoals from Corsica are interesting but it ultimately failed to test superior to Corsi or other shot differentials in predicting future success (both player, goalie, and team level).
DTM's xGoals is what I normally use, which is public, sorta, but does not have a public database like Corsica for anyone to garner the data whenever they want. You have to follow DTM and see his occasional updates or ask him for the data.
DTM's model actually outperforms shot metrics (like Corsi, sv%, and such) in predicting future success. Write up is here: https://hockey-graphs.com/2015/10/0...predictor-of-future-scoring-than-corsi-goals/
Biggest differences for DTM's model is that it has different manpowers trained (like 5v4, 5v5, empty net, etc. are treated differently) while Corsica's are not, and DTM's model uses regressed history of shooter.
")
Is there a site that tracks 5v5 p/60 for WHL?
Is there a site that tracks 5v5 p/60 for WHL?
Some interesting Corsi tidbits at the game17 mark...
Unsurprisingly, the Jets are third in the league in TOI at 5v5 when trailing (behind Vancouver and Calgary).
However, we are among the bottom quartile in xGF% and CF% in that 5v5-trailing score state.
If we need 15-20 games before Corsi can be considered reliable, we probably need at least 30 games before different slices of Corsi become reliable or relevant
Is there a site that tracks 5v5 p/60 for WHL?
If we need 15-20 games before Corsi can be considered reliable, we probably need at least 30 games before different slices of Corsi become reliable or relevant
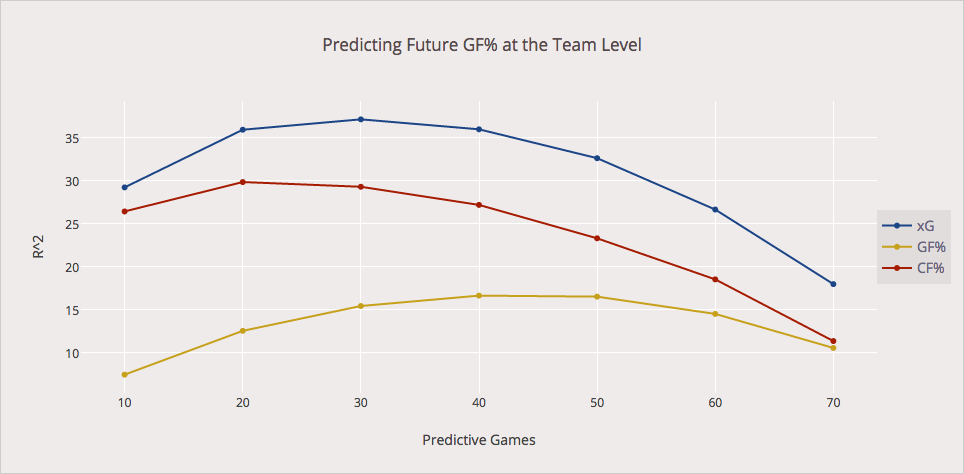
Note: Above graph uses DTM's xGoals model. Corsica's would have a line below Corsi% and above Goal%.
So, at best they explain about a third of the variance (R*2)?
Predicting something that is inherently difficult to predict due to being fraught of variance and outliers (plus rosters and coaches change) is difficult to predict.
If it were not so, goals and wins wouldn't be such a bad stat to evaluate teams early.
Might also mean plenty of room for improvement either through me variables or better adjustments with existing variables.
I agree there is room for improvement, but I am severely skeptical on the use of the term plenty.
Hockey is such a low scoring game, where scoring mostly is generated from capitalizing on a mistake where you don't score over 90% of the time in those occasions, and being one of the highest parity sports where one goal is often the difference between W-L... that all really reduces the limits to success no matter whatever the data you have.
1) "Luck" is a huge driver of success in hockey.
a) Comparing to a coinflip we find about 38% of success to be randomness:
http://www.arcticicehockey.com/2010/11/22/1826590/luck-in-the-nhl-standings
b) Machine learning estimating randomness is about 38% of success:
http://nhlnumbers.com/2013/8/1/mach...y-is-there-a-theoretical-limit-on-predictions
c) about 2/3rds of sh% differences is explained by variance:
http://objectivenhl.blogspot.ca/2011/05/even.html
2) With each improvement, the slice of the pie remaining becomes smaller and smaller.
We already look at a large chunk of shot quantity and we likely have the bulk of shot quality.
The bulk missing bits are not being attempted to be measured by these models, which is stuff like special teams and goalie talent (special teams being not measured by either dependent or independent variable in this case).
3) Then there is the human element that would never be recovered from the data.
In the end, it is going to be difficult and there are severe limitations to predict a variable of "success" that already has a seriously low autocorrelation to itself.
Maybe there are "clutch" players and teams after all.
It's been interesting watching the Jets transition from a big, heavy team that was a Corsi beast to a much quicker and more talented team that seems able to win without dominating shot metrics. I think this much more skilled team might not end up so high on the shot metrics but if they get decent goaltending they'll be much closer to a championship team. Of course, they should be able to do both, but I've noticed that this team gives up shot opportunities to get better scoring opportunities. They don't always result in a shot or even a scoring chance, but when they do they capitalize. It'll be interesting to see how this team develops.
It was interesting watching the Jets transition from a good team that a team that has high upside but has a lot to improve upon. Any team in the league can win in the short run. I think if the team is skilled but not so high on the shot metrics they will not be a better team. If they got goaltending that is simply something they didn't have before that they'd have then. The numbers don't match with your hypothesis of what the team is currently doing.

It was interesting watching the Jets transition from a good team that a team that has high upside but has a lot to improve upon. Any team in the league can win in the short run. I think if the team is skilled but not so high on the shot metrics they will not be a better team. If they got goaltending that is simply something they didn't have before that they'd have then. The numbers don't match with your hypothesis of what the team is currently doing.