Visual representation of 82 game point stretches

matnor

Registered User
Oct 3, 2009
512
3
Boston
During the last couple of seasons, quite a lot was made of Crosby's point per game pace. Some people argued that it wasn't as impressive as it seemed because it was misleading to pro-rate his scoring pace, while others pointed out that over the last 82 games he had scored significantly above 130 points. The problem was that we really didn't have anything to compare with. There was no easily accessible data (as far as I know) on how common it was for a player to score at such a high pace for a (somewhat cherry-picked) 82 game stretch.

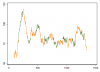
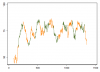
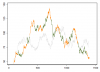
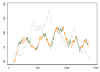
Using game-by-game data, available for the 87/88 season and onwards, I have created a visual representation for all 82 game point stretches for a couple of select players. These can be seen in the attached PDF file. For each game, seen along the x-axis, the y-axis show the amount of points scored over the last 82 games. For each player, I have also written out their best and worst 82 game point stretch. The first figure shows a comparison between Jaromir Jagr and Joe Sakic, two of the most prolific scorers with long careers that started after the 87/88 season. The second figure shows a comparison between Sidney Crosby, Evgeni Malkin and Alex Ovechkin. Finally, the third figure shows a comparison between Sidney Crosby, Peter Forsberg and Eric Lindros, three players with injury-riddled careers. Because these three players played at different times, I have used adjusted points (adjusted by the scoring pace of the ten percent highest scoring players in a given season) to account for their respective scoring environment.

Some features I think are nice with these graphs:

*Provides a visual representation of a player's scoring over his career, showing both ebbs and flows in scoring.

*Makes it easier to contextualize number such as player X has scored Y amount of points during the last 82 games.

*Facilitate a reasonable comparison of players who were injured a lot to players who were relatively injury free without giving an unfair advantage to either group.

So far I have used game-by-game data from 87/88 which are of high quality. I could add HSP data from the 52/53 season. These data are of slightly lower quality (but still excellent) but would facilitate a comparison of players from different eras. This is pretty much work in progress so any thoughts or comments on how these graphs could be improved would be very much appreciated! If you have any players you would like to see a comparison of, let me know and I might be able to provide it.


Mod edit: Sometimes people have issues with being able to download attachments.

I've thrown a copy of it on my google drive: Link here

You should be able to easily view/download it from there
 

Attachments

  • 82game.pdf
    138.5 KB · Views: 120
Last edited by a moderator:

matnor

Registered User
Oct 3, 2009
512
3
Boston
What is your ultimate conclusion?

Well, at this point it's not so much about drawing conclusions about specific players, but rather to discuss whether these graphical representations is something that can be useful, what the drawbacks are, and whether they should be improved in any way. That being said, I think it's possible to draw some conclusions about the figures I attached.

Figure 1:

-The figure mostly shows that Jagr was a much more prolific point producer than Sakic, no surprise there.
-Perhaps more noteworthy is that after the last game of the calendar year of 1999, Jagr had 147 points in his last 82 games, in the middle of the dead puck era.

Figure 2:

-Crosby has had the best 82 game point stretch in which he had 140 points. Ovechkin is second with 134 points and Malkin third with 127 points.
-Most noteworthy: During his career, Crosby only had two games in which he had less than 100 points during his last 82 games. This occured by the end of the 09/10 season.

Figure 3:

-By the 350 game mark, Crosby, Forsberg and Lindros are remarkably similar. After that Crosby really took off while Lindros really tailed off.
-Forsberg's peak during the 02/03 and 03/04 seasons is not that far off from Crosby's peak.
 

Andros

Registered User
Dec 8, 2011
45
0
Finland
I don't have much of anything actually relevant to say, but with this post not getting all that many comments I just wanted to stop by to say that the work is interesting and appreciate the effort put into it.

Judging a player's offense purely on a "by season basis" seems fairly arbitrary when trying to assess the underlying skill level, and could cost us some detail when comparing merits. This type of approach helps with that, though obviously it's a lot easier and cleaner to just look at seasons, rather than coming up with the numbers on what kind of stretches are relevant.

Would love to see the graph for some player known for consistency over a long stretch of seasons, like Sundin for example. Just to see if the in season fluctuations are as steady as the season totals would suggest.
 

matnor

Registered User
Oct 3, 2009
512
3
Boston
I don't have much of anything actually relevant to say, but with this post not getting all that many comments I just wanted to stop by to say that the work is interesting and appreciate the effort put into it.

Judging a player's offense purely on a "by season basis" seems fairly arbitrary when trying to assess the underlying skill level, and could cost us some detail when comparing merits. This type of approach helps with that, though obviously it's a lot easier and cleaner to just look at seasons, rather than coming up with the numbers on what kind of stretches are relevant.

Would love to see the graph for some player known for consistency over a long stretch of seasons, like Sundin for example. Just to see if the in season fluctuations are as steady as the season totals would suggest.

Thanks, I attach two graphs for Sundin, one unadjusted and one adjusted. As can be seen from the graph over adjusted points, he has indeed been consistent. It should be noted that graphs like these will look like they contain trends even if data are purely random.
 

Attachments

  • MatsSundin.png
    MatsSundin.png
    14.1 KB · Views: 17
  • MatsSundin_adj.png
    MatsSundin_adj.png
    15.3 KB · Views: 13

Viktri

Registered User
Apr 25, 2007
509
1
Vancouver
Thanks hatterson for that link.

matnor very interesting, I think I learned something and I agree with the insights that you've already noted.
 

Crease

Chief Justice of the HFNYR Court
Jul 12, 2004
24,108
25,587
I like the idea of rolling numbers. 82-game rolling totals is natural starting point. I wonder if it makes sense to look at rolling totals for longer periods of time (e.g., 100 games) or shorter periods of time (e.g., 20 games).
 

matnor

Registered User
Oct 3, 2009
512
3
Boston
I like the idea of rolling numbers. 82-game rolling totals is natural starting point. I wonder if it makes sense to look at rolling totals for longer periods of time (e.g., 100 games) or shorter periods of time (e.g., 20 games).

Yeah, that can be interesting (unless, of course, one cherry-pick a particular time frame to pump the tires of one's favourite player). Here are top 10 lists for most points for a given number of consecutive games since the 87/88 season.


Most points in 10 consecutive games

Rank | Player | Points | Points per game
1. | Mario Lemieux | 37 | 3.70
2. | Bernie Nicholls | 30 | 3.00
2. | Luc Robitaille | 30 | 3.00
4. | Wayne Gretzky | 29 | 2.90
4. | Brett Hull | 29 | 2.90
4. | Jari Kurri | 29 | 2.90
4. | Pat Lafontaine | 29 | 2.90
4. | Adam Oates | 29 | 2.90
4. | Denis Savard | 29 | 2.90
10. | Kevin Stevens | 28 | 2.80


Most points in 20 consecutive games

Rank | Player | Points | Points per game
1. | Mario Lemieux | 66 | 3.30
2. | Wayne Gretzky | 54 | 2.70
3. | Brett Hull | 51 | 2.55
4. | Bernie Nicholls | 50 | 2.50
4. | Adam Oates | 50 | 2.50
4. | Steve Yzerman | 50 | 2.50
7. | Pat Lafontaine | 47 | 2.35
7. | Denis Savard | 47 | 2.35
9. | Peter Forsberg | 45 | 2.25
9. | Jaromir Jagr | 45 | 2.25


Most points in 30 consecutive games

Rank | Player | Points | Points per game
1. | Mario Lemieux | 90 | 3.00
2. | Wayne Gretzky | 77 | 2.57
3. | Bernie Nicholls | 72 | 2.40
4. | Steve Yzerman | 68 | 2.27
5. | Jaromir Jagr | 67 | 2.23
5. | Adam Oates | 67 | 2.23
7. | Brett Hull | 66 | 2.20
8. | Pat Lafontaine | 62 | 2.07
9. | Kevin Stevens | 61 | 2.03
10. | Denis Savard | 59 | 1.97


Most points in 40 consecutive games

Rank | Player | Points | Points per game
1. | Mario Lemieux | 114 | 2.85
2. | Wayne Gretzky | 97 | 2.42
3. | Steve Yzerman | 88 | 2.20
4. | Bernie Nicholls | 87 | 2.17
5. | Jaromir Jagr | 86 | 2.15
6. | Adam Oates | 85 | 2.13
7. | Brett Hull | 80 | 2.00
8. | Pat Lafontaine | 77 | 1.92
9. | Denis Savard | 76 | 1.90
10. | Sidney Crosby | 75 | 1.88
10. | Kevin Stevens | 75 | 1.88


Most points in 50 consecutive games

Rank | Player | Points | Points per game
1. | Mario Lemieux | 145 | 2.90
2. | Wayne Gretzky | 119 | 2.38
3. | Bernie Nicholls | 106 | 2.12
3. | Steve Yzerman | 106 | 2.12
5. | Adam Oates | 101 | 2.02
6. | Jaromir Jagr | 100 | 2.00
7. | Pat Lafontaine | 97 | 1.94
8. | Brett Hull | 93 | 1.86
9. | Kevin Stevens | 91 | 1.82
10. | Robert Brown | 90 | 1.80
10. | Sidney Crosby | 90 | 1.80


Most points in 82 consecutive games

Rank | Player | Points | Points per game
1. | Mario Lemieux | 218 | 2.66
2. | Wayne Gretzky | 193 | 2.35
3. | Steve Yzerman | 162 | 1.98
4. | Bernie Nicholls | 155 | 1.89
5. | Jaromir Jagr | 154 | 1.88
6. | Pat Lafontaine | 150 | 1.83
7. | Brett Hull | 146 | 1.78
7. | Adam Oates | 146 | 1.78
7. | Kevin Stevens | 146 | 1.78
10. | Alexander Mogilny | 142 | 1.73


Most points in 100 consecutive games

Rank | Player | Points | Points per game
1. | Mario Lemieux | 257 | 2.57
2. | Wayne Gretzky | 231 | 2.31
3. | Steve Yzerman | 193 | 1.93
4. | Bernie Nicholls | 184 | 1.84
5. | Pat Lafontaine | 179 | 1.79
6. | Jaromir Jagr | 178 | 1.78
7. | Brett Hull | 172 | 1.72
8. | Sidney Crosby | 171 | 1.71
8. | Kevin Stevens | 171 | 1.71
10. | Adam Oates | 170 | 1.70

Of course, due to the high scoring at the time, these lists mostly include players from the late 80s and early 90s
 

DL44

Status quo
Sep 26, 2006
17,904
3,827
Location: Location:
Looking at Jagr and Sakic charts... are there any correlating events in relation to their peaks and valleys?

i.e. was it a certain time of year? a playoff run? linemate changes? coaching changes?

Edit: just noticed seasons are depicted on the charts...
 

friction

5-14-6-1
Nov 17, 2003
5,602
7
Calgary
Most Points in 82 Consecutive Games
Rank | Player | Points | Points per game
1. | Mario Lemieux | 218 | 2.66
2. | Wayne Gretzky | 193 | 2.35
3. | Steve Yzerman | 162 | 1.98
4. | Bernie Nicholls | 155 | 1.89
5. | Jaromir Jagr | 154 | 1.88
6. | Pat Lafontaine | 150 | 1.83
7. | Brett Hull | 146 | 1.78
7. | Adam Oates | 146 | 1.78
7. | Kevin Stevens | 146 | 1.78
10. | Alexander Mogilny | 142 | 1.73

I'm confused. Gretzky had 215 points in 85-86. How is his best ever 82-game stretch only 193?

EDIT: Got it, missed the "since 87/88" part.
 

matnor

Registered User
Oct 3, 2009
512
3
Boston
Looking at Jagr and Sakic charts... are there any correlating events in relation to their peaks and valleys?

i.e. was it a certain time of year? a playoff run? linemate changes? coaching changes?

Edit: just noticed seasons are depicted on the charts...

Well, because the same game is counted 82 times, the graph will always have trends, even if data is completely random.

As for Jagr and Sakic, using adjusted data gives a more smooth distribution (see attachments). The peak for Jagr corrsponds to the middle of the 99/00 season, while Sakic had a couple of years between 99 and 01 where he had between 100 and 110 adjusted points per 82 games.

I should also mention that only regular season data are used.
 

Attachments

  • Jagr.png
    Jagr.png
    19 KB · Views: 9
  • Sakic.png
    Sakic.png
    19.3 KB · Views: 6

Ad

Upcoming events

Ad

Ad