Traditional Standings

Mythras

Registered User
Feb 23, 2010
209
9
Was wondering what they'd look like with just W, L, T, so I put it together. Not anything you haven't seen before, but I figured I might as well post it since I had it done. Couple of the records don't look quite as good, and some look a lot better in this format.
 

Attachments

  • Standings.jpg
    Standings.jpg
    159 KB · Views: 126

Bear of Bad News

Your Third or Fourth Favorite HFBoards Admin
Sep 27, 2005
13,549
27,109
Always interesting, although I question why teams would perform identically if they were rewarded/incentivized differently.

In fact, the primary reason for the new point rules was to incentivize teams differently.
 

Tough Guy

Registered User
Jan 26, 2013
1,006
0
The number of ties is ASTRONOMICAL. I just looked up a random season (1992-93) and there were less ties in a full 84-game season than there have been in 25 games so far this year. The team with the most ties that season was Chicago (only 12 ties in 84 games). Nashville already has 11.

The loser point is clearly acting as an incentive to sit on ties and hold out until overtime or the shootout.
 

Wats

Error 520
Mar 8, 2006
42,015
6,689
This is the old old format where there is not even a 5min 5 on 5 OT after 60 minutes.
 

Stats01

Registered User
Jul 12, 2009
20,386
0
Toronto
Was wondering what they'd look like with just W, L, T, so I put it together. Not anything you haven't seen before, but I figured I might as well post it since I had it done. Couple of the records don't look quite as good, and some look a lot better in this format.

LMFAO @Ottawa, seriously..8 ties. God I can't stand the shootout. Of course going by that we only have 3..but tied in points cause of that stupid loser point rule. FFS.

Barely over .500 at 10-8-8 and they're tied for 5th..holy ****
 

Mythras

Registered User
Feb 23, 2010
209
9
The amount of ties surprised me as well.

I'll update this at season end
 

SealsFan

Registered User
May 3, 2009
1,716
506
Good work, very interesting. I don't like modern hockey with 30 teams and these confusing overtime losses and shoot-outs. I look at the standings and its too vague; I wish I could just see wins, losses and ties as a way to assess teams again.
 

DL44

Status quo
Sep 26, 2006
17,904
3,827
Location: Location:
The number of ties is ASTRONOMICAL. I just looked up a random season (1992-93) and there were less ties in a full 84-game season than there have been in 25 games so far this year. The team with the most ties that season was Chicago (only 12 ties in 84 games). Nashville already has 11.

The loser point is clearly acting as an incentive to sit on ties and hold out until overtime or the shootout.

You have got to consider the difference in parity in that era compared to more recent one. Also the high scoring nature of the games back then simply further reduced the likelihood of games ending in ties.

If you want to more accurately compare to similar scoring level.. compare the last season of ties to now... i believe in '99? dead puck era. Or the last season prior to shootout outs.

I would imagine a less drastic difference.


And then the obvious #1 factor - The fact ties don't actually exist today... so the system plays its part in effecting how teams play. So this attempt of a comparison isn't really a valid one in the 1st place..
 
Last edited:

GuineaPig

Registered User
Jul 11, 2011
2,425
206
Montréal
The loser point is essentially a subsidy for bad teams. It creates artificial parity, and these standings show that pretty well.
 

Mythras

Registered User
Feb 23, 2010
209
9
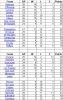
As promised, here is the final standings re-done in the traditional format:

Teams W L T P
1 y-Pittsburgh 31 12 5 67
2 y-Montreal 24 14 10 58
3 y-Washington 20 18 10 50
4 x-Boston 23 14 11 57
5 x-Toronto 24 17 7 55
6 x-Ottawa 19 17 12 50
7 x-NY Islanders 18 17 13 49
8 x-NY Rangers 18 18 12 48

9 Philadelphia 20 22 6 46
10 Winnipeg 18 21 9 45
11 New Jersey 16 19 13 45
12 Carolina 17 25 6 40
13 Buffalo 13 21 14 40
14 Tampa Bay 16 26 6 38
15 Florida 11 27 10 32

1 z-Chicago 25 7 16 66
2 y-Anaheim 23 12 13 59
3 y-Vancouver 20 15 13 53
4 x-Los Angeles 24 16 8 56
5 x-Detroit 20 16 12 52
6 x-St. Louis 20 17 11 51
7 x-San Jose 17 16 15 49
8 x-Minnesota 19 19 10 48

9 Phoenix 16 18 14 46
10 Columbus 14 17 17 45
11 Dallas 18 22 8 44
12 Edmonton 15 22 11 41
13 Calgary 17 25 6 40
14 Nashville 11 23 14 36
15 Colorado 11 25 12 34

I am too tired to properly format, but the teams have been reordered to reflect the new totals; the numbers from lest to right are wins, losses, ties, and points

Under this system, all 16 playoff teams would remain the same, but these would be the match-ups:

NYR @ Pittsburgh
NYI @ Montreal
Ottawa @ Washington
Toronto @ Boston

Minnesota @ Chicago
SJ @ Anaheim
STL @ Vancouver
Detroit @ LA
 

Ad

Upcoming events

Ad

Ad