The Advanced Stats Thread Episode IX

SnowblindNYR

HFBoards Sponsor
Sponsor
Nov 16, 2011
52,448
31,198
Brooklyn, NY
My observation, admittedly without any effort or analysis whatsoever, has been that there are usually 2-3 really good coaches in the league at any time who are able to move the needle in a positive direction just by virtue of being with a team. Trotz is the big example that comes to mind currently. Gallant is getting there. Darryl Sutter always had his Kings teams punching well above their weight class.

Otherwise I think the difference between the rest are more or less negligible. I mean, looking back at the list of Jack Adams winners you see guys like Bob Hartley, Patrick Roy, Doug Maclean, Dan Bylsma etc. While the NHL awards are not definitive it's always seemed to me like hockey coaches more than any other sport are the cream of the crop one year and out of a job the next. I remember people on these boards were absolutely swooning over Bylsma when Pitt was winning and after the HBO special like he was Scotty Bowman and now he's the AC for the Wings.

Interested to see what you come up with.

Yeah, that's my hypothesis as well. I'll basically try to compare results gained with a certain coach vs. those gained without him, link that to wins and compare.
 

SnowblindNYR

HFBoards Sponsor
Sponsor
Nov 16, 2011
52,448
31,198
Brooklyn, NY
I just had a detour because when I forecasted, I forecasted individual PDOs rather than team PDOs. In a particular season I got -10 projected points because I was looking at George Parros's PDO which was like 85. I ended up wasting a good bit of time but thought this was funny.
 

aufheben

#Norris4Fox
Jan 31, 2013
53,669
27,370
New Jersey
I'm about to embark on an exciting project that will attempt to answer who are the best coaches in the league. It'll involve a lot of data, so it will probably take a few weeks. But I'm super excited.
I read a stat-based article on this the other day which I can’t find at the moment, but it was a bit dated. Like 5 years old. I think Daryl Sutter was #1, Bruce Boudreau was excellent. Julien and Therrien were high. Torts was average or very slightly above average.

edit: I see the Athletic did a more recent one using Micah’s model:

 
Last edited:
  • Like
Reactions: SnowblindNYR

SnowblindNYR

HFBoards Sponsor
Sponsor
Nov 16, 2011
52,448
31,198
Brooklyn, NY
I read a stat-based article on this the other day which I can’t find at the moment, but it was a bit dated. Like 5 years old. I think Daryl Sutter was #1, Bruce Boudreau was excellent. Julien and Therrien were high. Torts was average or very slightly above average.

edit: I see the Athletic did a more recent one using Micah’s model:


Interesting, my coaches look different, I wonder what their methodology was.
 

aufheben

#Norris4Fox
Jan 31, 2013
53,669
27,370
New Jersey
Interesting, my coaches look different, I wonder what their methodology was.
Well for one thing it's only a one-season sample size, several of those coaches were first-years, and some were fired/hired at various points throughout the season. The other article I looked at was interesting because the sample size was entire careers of active coaches. I can't for the life of me find it now; I just googled some combinaion of "NHL/rank/coaches/best/stats".
 

SnowblindNYR

HFBoards Sponsor
Sponsor
Nov 16, 2011
52,448
31,198
Brooklyn, NY
Ok, I was wrong it won't take weeks. It took me a weekend. I have my list.

Here's my methodology:

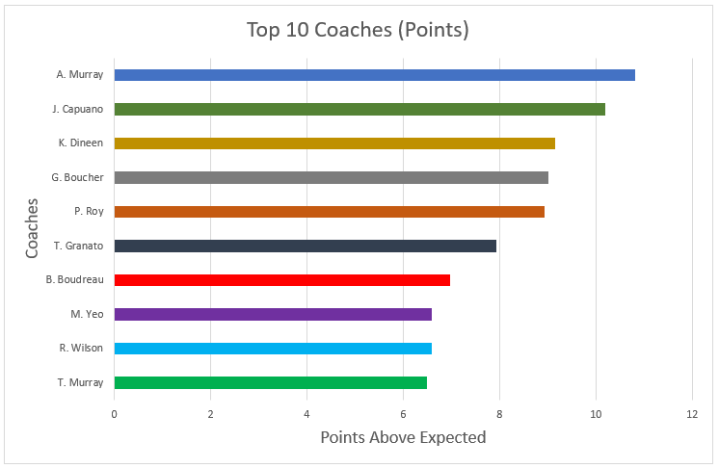
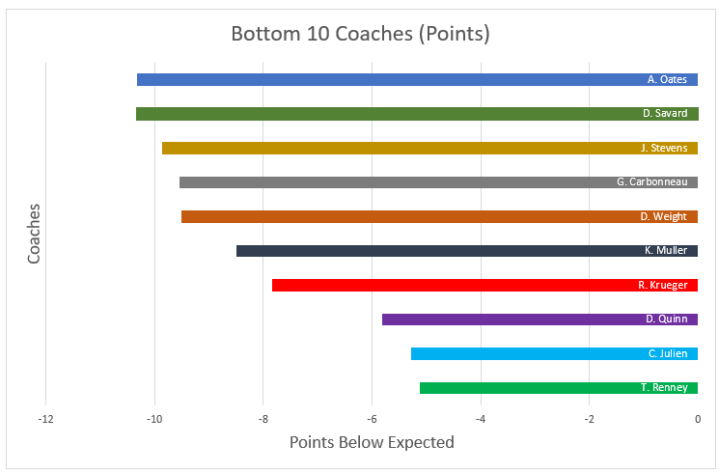
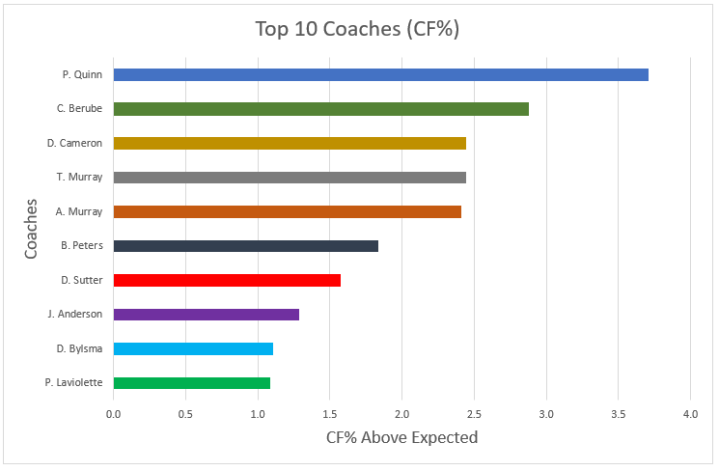
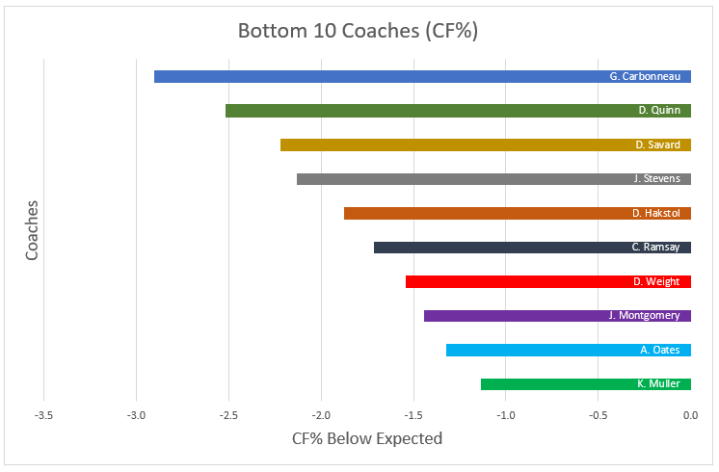
I went back with the data to 07-08, which is the first instance of the data. I looked at team CF% and PDO and regressed it against team points. My results were predictive and significant. I then looked at individual players and coaches. I took out all of the players that were on multiple teams because hockey reference doesn't state what the teams are so I wouldn't know who coached them. I included only players that played 60+ games which is a nice sample size and gets rid of fringe players. Plus, most importantly it means I have a manageable amount of data and don't have to download it for a week, haha. Next, I took a look at the relative Corsi for all players when playing under a different coach. Then using that average relative Corsi I added it to the actual off-ice Corsi (Corsi minus Rel Corsi). I took the average of those and adjusted it. Basically I took team CF% divided by average of all actual CF% for all players in my dataset (who played 60 games or more) and applied that multiple to the projected average. Now that I had the projected team CF%, I used that and actual PDO to forecast wins. Finally, I compared actual wins and projected wins. I also compared actual Corsi and projected Corsi. The finally output is the 10 best and worst coaches on those two metrics. Next, I'll add this to my blog.

View attachment 278871

View attachment 278877

I took a look at the average compared to what was expected and the most successful and least successful teams of these coaches. As you can see a couple of these teams performed better/worse than their CF% would suggest as their CF% is actually not that far off from their projected CF% but the actual wins are lot higher/lower than projected. I checked the PP to see if it's favorable/unfavorable and while it's more relative PP performance to expected rather than absolute that's important it still didn't seem like that was it. It's possible that some teams just out/underperformed their CF% and PDO by winning close games and losing blowouts and vice versa. This is why the next chart is also an interesting look, it looks at CF% without transforming it into wins.

View attachment 278879

upload_2019-11-17_19-35-35.png


BTW, it looks like Quinn is bottom 10 for both.
 

SnowblindNYR

HFBoards Sponsor
Sponsor
Nov 16, 2011
52,448
31,198
Brooklyn, NY
I made changes to make it much more readable and added a summary section and some charts and pictures based off feedback I got.

In a nutshell below is most pertinent data:

top-10-coaches-by-points-chart.png


bottom-10-coaches-by-points-chart.png


top-10-coaches-by-cf-chart.png


bottom-10-coaches-by-cf-chart.png
 
  • Like
Reactions: MikaIsGod

SnowblindNYR

HFBoards Sponsor
Sponsor
Nov 16, 2011
52,448
31,198
Brooklyn, NY
how did you determine points expected?

I regressed CF% and PDO against points. Then I estimated the average relative Corsi for each player while playing for a different coach. For example, 2007-08 Jagr's relative Corsi under a different coach would be the estimated relative Corsi for any season that he had in the dataset, going from 07-08 through 18-19 where he played under a coach that wasn't Tom Renney. I the estimated Jagr's off-ice CF% and substituted his actual relative Corsi % with this projected one under a different coach, therefore getting his projected CF% under a different coach and mitigating for team effects. I then adjusted that CF % by a multiple that I got by dividing actual team Corsi and the team Corsi obtained from (weighted) averaging the players of that team. I then applied that multiple to project the average of each player under a different coach for that season to what would be a team CF% if that all of that team's players had the stats they had under other coaches. I took that number, combined with team actual PDO, and forecasted points using the regression.

I hope that wasn't too confusing but I tried to include every step since you asked!
 
  • Like
Reactions: Leetch3

SnowblindNYR

HFBoards Sponsor
Sponsor
Nov 16, 2011
52,448
31,198
Brooklyn, NY
I did realize I have a problem with my methodology. While looking at performance under other coaches does a good job of taking away the effects of the coach you're comparing, the CF% that the player has will always change and therefore career average may be a better way to do this. I guess there are positives and negatives to this.

Edit: That said there are enough players on teams where this may be mitigated. So looking at "all other coaches" with a large enough sample size of players may actually work.
 
Last edited:

Leetch3

Registered User
Jul 14, 2009
12,953
10,737
I regressed CF% and PDO against points. Then I estimated the average relative Corsi for each player while playing for a different coach. For example, 2007-08 Jagr's relative Corsi under a different coach would be the estimated relative Corsi for any season that he had in the dataset, going from 07-08 through 18-19 where he played under a coach that wasn't Tom Renney. I the estimated Jagr's off-ice CF% and substituted his actual relative Corsi % with this projected one under a different coach, therefore getting his projected CF% under a different coach and mitigating for team effects. I then adjusted that CF % by a multiple that I got by dividing actual team Corsi and the team Corsi obtained from (weighted) averaging the players of that team. I then applied that multiple to project the average of each player under a different coach for that season to what would be a team CF% if that all of that team's players had the stats they had under other coaches. I took that number, combined with team actual PDO, and forecasted points using the regression.

I hope that wasn't too confusing but I tried to include every step since you asked!

giphy.gif
 

Leetch3

Registered User
Jul 14, 2009
12,953
10,737
LMAO! Point taken. I'll try to answer it higher level. I originally gave all of the details in case you were interested:

I got a CF% under other coaches (with a minor adjustment) and then forecasted wins by putting it into a regression model.

oh your explanation was fine. its my own stupidity that is the issue lol
 
  • Like
Reactions: SnowblindNYR

SnowblindNYR

HFBoards Sponsor
Sponsor
Nov 16, 2011
52,448
31,198
Brooklyn, NY
BTW, my next project is "the best team money could buy". I'm still not sure if I can do what I want to do but hopefully I'll be able to do it. Basically, I'll build a team that fits the salary cap and gives you the best bang for your buck when it comes to CF%.
 

Anzi

Registered User
May 16, 2019
817
1,032
Boston
I get the idea of shooting percentages regressing to the mean but I feel like it's flawed logic to decide that their career averages is what the mean is. There's more factors than just luck at play. You have to look at things like shooting volume, quality of shots, etc to provide context to the shooting percentages.
 

Ad

Upcoming events

  • Czechia vs Switzerland
    Czechia vs Switzerland
    Wagers: 6
    Staked: $1,214.00
    Event closes
    • Updated:
  • Sweden vs Germany
    Sweden vs Germany
    Wagers: 1
    Staked: $325.00
    Event closes
    • Updated:
  • Fiorentina vs Monza
    Fiorentina vs Monza
    Wagers: 4
    Staked: $20,305.00
    Event closes
    • Updated:
  • Aston Villa vs Liverpool
    Aston Villa vs Liverpool
    Wagers: 6
    Staked: $10,352.00
    Event closes
    • Updated:
  • FC Barcelona vs Real Sociedad
    FC Barcelona vs Real Sociedad
    Wagers: 5
    Staked: $1,745.00
    Event closes
    • Updated:

Ad

Ad