Proposal: Statistical Analysis

Kurtz

Registered User
Jul 17, 2005
10,108
6,985
A "perfect" correlation containing three data points.

:laugh::laugh:

Get this...for the past three days I made toast with whole-wheat bread and my toaster didn't short-circuit.

I guess you can say that toasters are more reliable when you use whole-wheat bread, right?

Oh yeah, you're right, I read the text but didn't notice that there are only 3 data points graphed.

Yeah, that's kinda laughable. You can't draw proper correlation results with only 3 data points....
 

Bomber0104

Registered User
Apr 8, 2007
15,086
6,951
Burlington
It's the eye-test with a defined objective, and conscious understanding of what is being analyzed, not a bunch of disgruntled Men mashing their keyboards in frustration. You're watching the game with a complete lack of understanding, and with the thought that you're capable of processing the minutiae (and total events) of every game. You look at a bad pass and claim that the player sucks, even if said player made 10 sublime plays prior to the gaff.

There's a difference between 'tracking' and 'watching'.

It's the eye-test with a set of parameters that are arbitrarily made by people with no experience in hockey and who quite clearly don't understand what the success factors are.

There's a whole lot of :

"Well this guy did this but he must not have meant to do that so we won't count it as a pass"

and

"Well this guy over here looked behind his shoulder a few seconds ago so he must have saw that player as he lobbed it up ice, so that's a good pass"

So basically there isn't much consistency, clarity, and logic behind how any sort of pass, play, and sequence is measured and qualitatively measured between the "eye-testers".

Not sure how you expect a system like that to be taken seriously by anyone.
 

Bomber0104

Registered User
Apr 8, 2007
15,086
6,951
Burlington
Oh yeah, you're right, I read the text but didn't notice that there are only 3 data points graphed.

Yeah, that's kinda laughable. You can't draw proper correlation results with only 3 data points....

Sorry but this stuff is an absolute joke.

I appreciate the effort but this trial-and-error, novice kind of hobbyist stuff belongs in the By The Numbers forum....

Where it can be peer-reviewed and not intended to mislead people (kind of like 91Kadri91 just did to you).
 

91Kadri91*

Guest
:laugh:

Scoring goals is not a skill.

Excellent evaluation of the game of hockey!

Past goals don't necessarily result in future goals. If it was (as a singular measurement) a skill, there would be a modicum of reliability.

What else would correlate better than scoring chances to goal production?

The amount of popcorn sold in the stands?

Really, what variable on the ice would correlate better with goal-scoring than scoring chances?

Let me guess...

Corsi's!!!

It really depends how you 'classify' scoring chances. Your definition (from my recollection) doesn't account for volume, and makes no mention of quantified scenarios (such as rush shots, rebound shots, and shots from particular areas being proven to result in more goals); instead you elect to talk about screen shots (which account for a minuscule portion of shots at even-strength). Again, these 'new' micro-metrics allow one to gain a better understanding of how one creates scoring chances/goals, and if it's sustainable (if they're skilled, or if they're lucky).

And no, not Corsi.

So I see you just ignored what I said entirely and just regurgitated a random tidbit of information...

Once again...

Shot-based proxy possession numbers don't correlate with winning.

They do, moderately.

Goal differential does. That's how games are won. The team who outscores the other wins.

Yes, and how do you outscore your opponent? How do you get scoring chances? How do you determine whether a player is capable, or lucky? You're not going to win a bunch of hockey games throwing Dan Girardi out there, and yet there are traditional thinkers who believe that he is (or was) a top-pairing defenseman.

How do goals get scored? Through scoring chances. The team with more quality scoring chances score goals.

That's not always the case. Take the Canadiens as an example. Using data tracked by motion software (no reliance on the eye-test) you can see that the Canadiens are 'out-chancing' their opponents, but they're 3-6-1 in their last ten:


------------------------------------------------

I'm not going to comment on the last section, since it's just a regurgitated, misguided personal attack.
 

91Kadri91*

Guest
Oh yeah, you're right, I read the text but didn't notice that there are only 3 data points graphed.

Yeah, that's kinda laughable. You can't draw proper correlation results with only 3 data points....

Which I said... in my post... that you supposedly read.

You can't make any definitive conclusions, but it's promising nonetheless [the correlation with what you considered to be a reasonable sample (it's not) is 0.883].
 

Alerion

Registered User
Dec 24, 2012
11,036
5,109
Halifax, NS
The OP is one of the better posts on the Leafs board, period. Solid thread and I hope it generates positive discussion. I'm gonna dive into that OP a bit more in detail when I'm more awake tomorrow, I have a minor in statistics :laugh:
 

Bomber0104

Registered User
Apr 8, 2007
15,086
6,951
Burlington
Past goals don't necessarily result in future goals. If it was (as a singular measurement) a skill, there would be a modicum of reliability.

So you'd have people believe that putting a puck past an NHL goalie is as easy as making a pass up ice, a shot on net, a stick-check, a body-check, etc. ?

What is it about goal scoring exactly, that turns you off?

Let me ask you, you are aware that the game of hockey is decided through goal-scoring?

It really depends how you 'classify' scoring chances. Your definition (from my recollection) doesn't account for volume, and makes no mention of quantified scenarios (such as rush shots, rebound shots, and shots from particular areas being proven to result in more goals); instead you elect to talk about screen shots (which account for a minuscule portion of shots at even-strength). Again, these 'new' micro-metrics allow one to gain a better understanding of how one creates scoring chances/goals, and if it's sustainable (if they're skilled, or if they're lucky).

My classification of scoring chances accounts for a whole host of factors, not the least of which can be encapsulated in some silly little "one-size-fits-all" statistic that you and others think describes the ease or difficulty of the shot.

I gave you examples of how your silly little "scoring chance" charts fails when real-world conditions and applications are applied to it... (i.e. point shots , screens, passing plays, and of course velocity and placement)

I applaud you for summarizing where shots come from and how many of them scored but that has no correlation to the next shot from that area's ease or difficulty.

They do, moderately.

Wonderful but I have a feeling the team with the best goal-differential just might have an easier time winning games.

This is just rooted in an understanding of how games are won: outscoring the opponent.

The object of the game isn't to play keep-away.

Yes, and how do you outscore your opponent? How do you get scoring chances? How do you determine whether a player is capable, or lucky? You're not going to win a bunch of hockey games throwing Dan Girardi out there, and yet there are traditional thinkers who believe that he is (or was) a top-pairing defenseman.

You get goals by getting scoring chances. You get scoring chances by taking shots. You take shots by possessing the puck in the offensive zone.

There's a sequence of events that need to take place for a goal to happen.

The last possible one that does is a scoring chance.

Not a zone exit. Not a zone entry. Not even just a shot.

Scoring chances.

This is the missing link in your data and it is not a quantitative measure.

It is a qualitative measure.

That's not always the case. Take the Canadiens as an example. Using data tracked by motion software (no reliance on the eye-test) you can see that the Canadiens are 'out-chancing' their opponents, but they're 3-6-1 in their last ten:.

Again, there is simply no way for a computer to intelligently measure the quality of a scoring chance.

Measure the area a shot was taken tells you nothing about how easy or hard it was for the goalie to save.
 

91Kadri91*

Guest
I disagree/agree with this. Dumping it in to do a line change is a waste and very dumb as Don Cherry has said in the past, but it is a good idea to do it if teams are gonna stack the blue line. Carry it in every time if you have the chance but it isn't the worst idea to dump it in and chase.

You certainly can't carry it in every time (you need players that can retrieve loose-pucks; Anaheim, as a team, was superb at this last season, which is why they were very successful despite their middling Corsi), but my point was that 'Dump and Chase' shouldn't be the strategy. There are teams that look to dump the puck in and retrieve it, and that simply shouldn't be the primary strategy.

Also, is their any books explaining these kind of statistics to get a better understanding for them? Wouldn't mind reading something like that. Not a big fan of reading long articles on computers.

There's Hockey Abstract. I also enjoyed 'Soccernomics', 'What The Dog Saw' and 'Statistical Thinking in Sports', but they're not (in terms of all they're discussing) very hockey related. There's obviously books/textbooks that concern themselves more with statistical models, but I don't think I'd start there if I were you. It's a lot easier to read statistical models (and deduce their variables/conclusions) if you've already cultivated an interest in statistics.
 

Bomber0104

Registered User
Apr 8, 2007
15,086
6,951
Burlington
There's Hockey Abstract. I also enjoyed 'Soccernomics', 'What The Dog Saw' and 'Statistical Thinking in Sports', but they're not (in terms of all they're discussing) very hockey related. There's obviously books/textbooks that concern themselves more with statistical models, but I don't think I'd start there if I were you. It's a lot easier to read statistical models (and deduce their variables/conclusions) if you've already cultivated an interest in statistics.

On the contrary, I believe having a firm grasp of at least level one and two university-level statistics is the best place to start. It helps later on in life when the concepts of qualitative and quantitative data come up and become a source of confusion, you know what I mean?

Modelling is an upper-year undergrad / PhD subject and should not even be touched until the absolute fundamental statistical concepts are more firmly grasped and understood.

You know what my suggestion will be here so I won't even say it.
 

Teeder9

Free rent for Mo?
Oct 14, 2011
7,537
3
Ontario
I appreciate your enthusiasm for statistics, i really do, but you seem to be looking for a solution in need of a problem. Quoting you, "Past goals don't necessarily result in future goals." Nothing you can show will. All stats prove is what works yesterday.
 

91Kadri91*

Guest
So you'd have people believe that putting a puck past an NHL goalie is as easy as making a pass up ice, a shot on net, a stick-check, a body-check, etc. ?

No, I'm saying that there are a ton of (more reliable) variables that result in goals/goals against.

What is it about goal scoring exactly, that turns you off?

Nothing. A positive goal differential is the ideal result (it should be the goal, no pun intended), I just don't think looking at past goal-based results are an indication of future goal results.

Let me ask you, you are aware that the game of hockey is decided through goal-scoring?

And goal prevention.

My classification of scoring chances accounts for a whole host of factors, not the least of which can be encapsulated in some silly little "one-size-fits-all" statistic that you and others think describes the ease or difficulty of the shot.

Here's the thing: I (and many others) don't believe there's a 'one-size-fits-all' metric. If we did, we'd be preaching goal metrics.

I gave you examples of how your silly little "scoring chance" charts fails when real-world conditions and applications are applied to it... (i.e. point shots , screens, passing plays, and of course velocity and placement)

My silly little 'scoring chance' chart? First of all, those locations are substantiated by, y'know, results, so your complete dismal of them is laughable at best, and moronic at worst. Secondly, I referenced statistics/studies that account for rush shots (proven to result in more goals), deflections (more difficult to save, but account for a small percentage of 'shots'), rebound shots (proven to result in more goals), scramble shots (proven) and pre-shot movement (passing; proven to result in more goals/difficultly of saves is increased).

I applaud you for summarizing where shots come from and how many of them scored but that has no correlation to the next shot from that area's ease or difficulty.

It has a correlation with its likelihood of entering the net, though.

Wonderful but I have a feeling the team with the best goal-differential just might have an easier time winning games.

Yeah, but the better team doesn't always win; that's the problem with goal metrics.

This is just rooted in an understanding of how games are won: outscoring the opponent.

The object of the game isn't to play keep-away.

Sure, the object of the game is to outscore your opponents, but 'keep-away' is a way to do that.

You get goals by getting scoring chances. You get scoring chances by taking shots. You take shots by possessing the puck in the offensive zone.

There's a sequence of events that need to take place for a goal to happen.

And yet you're using the metric that has such a high unexplained variance that it's an outright awful statistic when using it to measure the abilities of a team/player in small (anything less than 5 years for goals) samples.

You do understand that a statistic must be both accurate (valid) and precise (reliable) for it to be legitimately useable (indicative), don't you?

The last possible one that does is a scoring chance.

Not a zone exit. Not a zone entry. Not even just a shot.

Scoring chances.

And you need a zone-entry, a zone-exit, a loose-puck recovery, a shot, a successful deke etc (or some combination of all of the above) to get to a scoring chance/goal (and that happen at a far higher rate than either scoring chances/goals).

It's entirely possible for a player to score at a very high rate (or put up a great goal differential) one year, and then hardly score the next season; it's because goals aren't reliable.

This is the missing link in your data and it is not a quantitative measure.

It is a qualitative measure.

Yeah, but it's not... at all.

You can qualify what events result in a higher 'percentage' of goals.

Again, there is simply no way for a computer to intelligently measure the quality of a scoring chance.

Measure the area a shot was taken tells you nothing about how easy or hard it was for the goalie to save.

SportLogIQ can measure far more than 'where the shot was taken'. They can measure screens, deflections, rebounds... everything you claim to be important when determining a scoring chance (but have yet to prove).
 

91Kadri91*

Guest
I appreciate your enthusiasm for statistics, i really do, but you seem to be looking for a solution in need of a problem. Quoting you, "Past goals don't necessarily result in future goals." Nothing you can show will. All stats prove is what works yesterday.

xGoals, Corsi, Passing Metrics, and Zone Data (etc) does a significantly better job of predicting future goals than past goals do.
 

4thline

Registered User
Jul 18, 2014
14,390
9,712
Waterloo
You certainly can't carry it in every time (you need players that can retrieve loose-pucks; Anaheim, as a team, was superb at this last season, which is why they were very successful despite their middling Corsi), but my point was that 'Dump and Chase' shouldn't be the strategy. There are teams that look to dump the puck in and retrieve it, and that simply shouldn't be the primary strategy.

See the problem is -to me atleast- that the data you presented (the two graphs) does not not at all support that conclusion. Correct me if I'm wrong but the "uncontrolled" seems to be graphing every dump in as a "zone entry", while the "controlled" graphs only times when the zone was actually entered -a successful attempt- and excludes times a team was turned back, went offside, was forced into a turnover.
One side measuring sucesses + failures, other only successes. A graph of only successful "uncontrolled" entries would certainly correlate stronger. Perhaps a ratio of successful attempts to unsuccessful, with the shot based data separated by entry type.

But what does will that tell us really? That teams get more shots when entering the zone successfully, that some teams (better ones?) can carry the puck in more, that some teams are better at puck retrieval, etc. No universal dominant strategy, just results.

To me a lot of these metrics are descriptors of good and bad play, not explanations at least not on a macro scale. The passing data is by far the most interesting but still leaves a lot to be desired.
 

91Kadri91*

Guest
On the contrary, I believe having a firm grasp of at least level one and two university-level statistics is the best place to start. It helps later on in life when the concepts of qualitative and quantitative data come up and become a source of confusion, you know what I mean?

Modelling is an upper-year undergrad / PhD subject and should not even be touched until the absolute fundamental statistical concepts are more firmly grasped and understood.

You know what my suggestion will be here so I won't even say it.

I'd argue that you'll lose interest if you start statistics by reading at a University level.

I got interested in statistics in high-school, so by the time I got to University I was eager to learn new concepts. I would never advise someone to join a statistics course (any course) without having a basic understanding of what was being presented (or what they represent); that's a lot of money to spend just to find out you have no interest in the concepts, or that you can't keep up.
 
Last edited by a moderator:

Menzinger

Kessel4LadyByng
Apr 24, 2014
41,213
32,901
St. Paul, MN
Thanks for putting this thread together.

Still strange how the mere mention of certain stats immediately leads to straw men and overly aggressive responses (which is why the ignore list function of the forum comes in handy).

Anyways, Maple Leafs Hot Stoves's scoring chance tracking project in particular has been an awful lot offen following - it's just a shame that the official NHL stat site is so inaccurate - Places like War on Ice are still so much better, though I really do miss Extra Skater.
 

Menzinger

Kessel4LadyByng
Apr 24, 2014
41,213
32,901
St. Paul, MN
I disagree/agree with this. Dumping it in to do a line change is a waste and very dumb as Don Cherry has said in the past, but it is a good idea to do it if teams are gonna stack the blue line. Carry it in every time if you have the chance but it isn't the worst idea to dump it in and chase.

In general I'm not a fan of dump and chase since it voluntarily gives up control of the puck - and most things I've read is that scoring chances tend to happen more often during "carry ins", that said it does depend on the make up of your team.

LA manages to make dump and chance work for them, since they're full of big grinders who can easily get the puck back. The same won't work for The Hawks who play a more finesse game.

It was particularly frustrating watching Carlyle's Leafs continue to use dump and chase since the team wasn't built for it- guys like Grabo and MacArthur were simply ineffective trying to implement it.
 

91Kadri91*

Guest
See the problem is -to me atleast- that the data you presented (the two graphs) does not not at all support that conclusion. Correct me if I'm wrong but the "uncontrolled" seems to be graphing every dump in as a "zone entry", while the "controlled" graphs only times when the zone was actually entered -a successful attempt- and excludes times a team was turned back, went offside, was forced into a turnover.

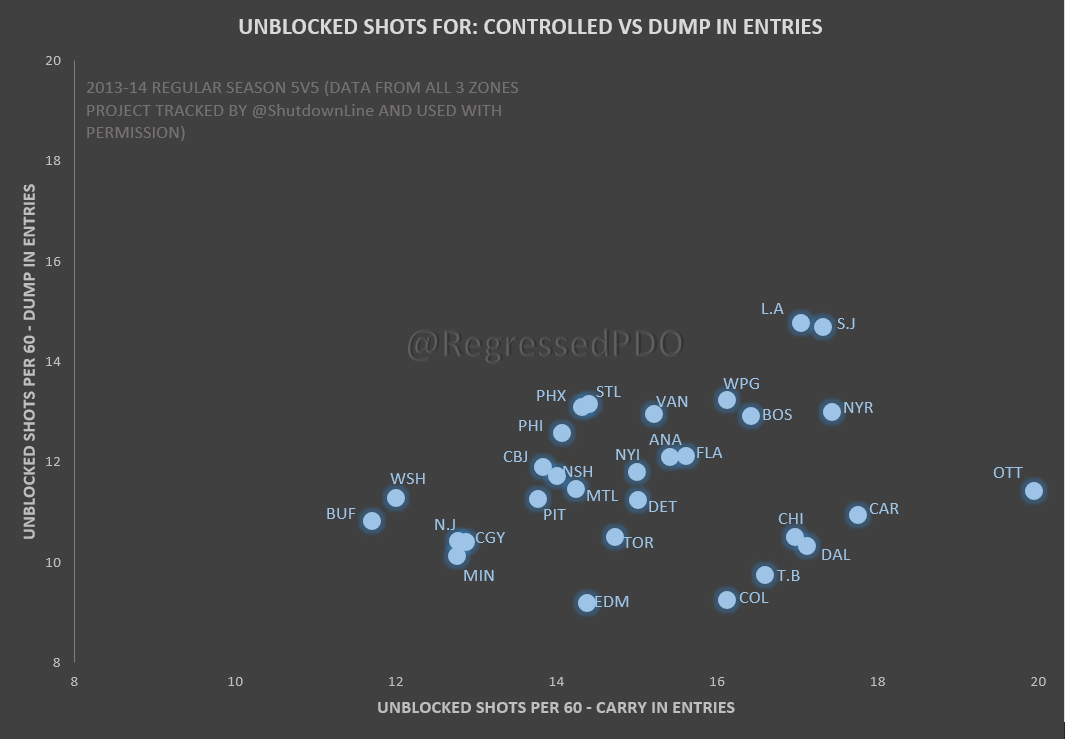
It's a rate (both the controlled and uncontrolled entry), so the more you enter the zone (per 60 minutes), the higher your controlled entry rate. You have to be successful at a higher rate (or attempt more entries) to have a higher Controlled Entries/60. It's basically just showing that teams should attempt entering the zone with possession more often than they should attempt to enter the zone with 'uncontrolled' possession.

One side measuring sucesses + failures, other only successes. A graph of only successful "uncontrolled" entries would certainly correlate stronger. Perhaps a ratio of successful attempts to unsuccessful, with the shot based data separated by entry type.

But 'Dump Ins' are successful at a significantly lower clip. Sure, a successful dump-in may result in a higher correlation (compared to the abysmal 0.75% it is showing), but most dump-ins will not result in a 'successful' entrance. Comparatively, while the controlled zone entries are 'success' rates, they're also far more likely to be 'successful' (since failures are accounted for in that unsuccessful teams will have a low rate of zone-entrances).

But what does will that tell us really? That teams get more shots when entering the zone successfully, that some teams (better ones?) can carry the puck in more, that some teams are better at puck retrieval, etc. No universal dominant strategy, just results.

That graph does not state which teams dump the puck in more, but this one does:

shots-for-dump-carry.png


And it doesn't show that it's a strategy, but it certainly is for some coaches:


My point wasn't that the graph indicates strategy, it was that said strategy is not one that a coach should employ.

To me a lot of these metrics are descriptors of good and bad play, not explanations at least not on a macro scale. The passing data is by far the most interesting but still leaves a lot to be desired.

Absolutely. The result should always be goals, but goals aren't a reliable statistic, and don't explain what created/caused them. These metrics help determine how sustainable a system/team/player is (how much can/cannot be attributed to ability).

EDIT: Actually, I believe those graphs are using 'All Three Zones' data, which differentiates 'failed entries' and 'dump-ins'.
 
Last edited by a moderator:

zeke

The Dube Abides
Mar 14, 2005
66,937
36,957
having a higher controlled entry/60 doesn't mean you are doing it more efficiently, though.

4thliner makes a very good point imo - do those controlled entry numbers account for failed attempts at controlled entries or not? moreover, isn't a failed controlled entry a much worse result than a failed dump and chase? blueline turnovers can be killer, while failed dump ins are still pretty safe results.
 

zeke

The Dube Abides
Mar 14, 2005
66,937
36,957
p.s. great thread. ignore the hate. in the end, valid stats will validate themselves by making better predictions.
 

4thline

Registered User
Jul 18, 2014
14,390
9,712
Waterloo
It's a rate (both the controlled and uncontrolled entry), so the more you enter the zone (per 60 minutes), the higher your controlled entry rate. You have to be successful at a higher rate (or attempt more entries) to have a higher Controlled Entries/60. It's basically just showing that teams should attempt entering the zone with possession more often than they should attempt to enter the zone with 'uncontrolled' possession.

But 'Dump Ins' are successful at a significantly lower clip. Sure, a successful dump-in may result in a higher correlation (compared to the abysmal 0.75% it is showing), but most dump-ins will not result in a 'successful' entrance. Comparatively, while the controlled zone entries are 'success' rates, they're also far more likely to be 'successful' (since failures are accounted for in that unsuccessful teams will have a low rate of zone-entrances).

My point wasn't that the graph indicates strategy, it was that said strategy is not one that a coach should employ.

And that's what I take issue with. Some teams should employ it (in balance) more than others. Not capturing the variability in the respective success rates and the results of each- whatever chosen metric- is a massive gap in the understanding of what works and doesn't work for each respective team or even line. Instead of "all teams should dump less because league wide dumping in more doesn't correlate with more possession" it should be "line 3 has a retrieval rate of x and a carry in success rate of y, with an attempt ratio of r:s resulting in a CF of.. etc etc.

Real useful stuff that can aid in game planning.

One of my biggest problems with statistics in hockey is that I think to much of the emphasis has been on developing "truths" league wide using flawed data in epidemiological styled macro research. All lot is being ignored because it doesn't show up across the whole forest, even if its blatantly visible in the tree. The tree is dismissed as too small of sample size, when what it is is a controlled environment with more variables held equal
 

91Kadri91*

Guest
having a higher controlled entry/60 doesn't mean you are doing it more efficiently, though.

4thliner makes a very good point imo - do those controlled entry numbers account for failed attempts at controlled entries or not? moreover, isn't a failed controlled entry a much worse result than a failed dump and chase? blueline turnovers can be killer, while failed dump ins are still pretty safe results.

And that's what I take issue with. Some teams should employ it (in balance) more than others. Not capturing the variability in the respective success rates and the results of each- whatever chosen metric- is a massive gap in the understanding of what works and doesn't work for each respective team or even line.

I looked at the definition provided by the 'All Three Zones' author (Corey Sznadjer), and here's what he had to say about controlled entries, dump-ins and failed entries:

my guideline is to not count anything where the player didn’t have possession for more than two full seconds as a “carry-in” or a successful zone entry.

Dump-ins where there is no effort to create offense are omitted, so dump-and-change plays are usually not counted. If there’s no forecheck or any attempt to create offense, there’s no point in logging it as a zone entry.

My general rule of thumb is any time a player tries to enter the zone and fails to get across the blue line, this includes failed dump-ins. Some trackers don’t include these, but I did for this project.

If we assume that every failed entry is the result of a failed carry-in, the 'shots per carry-in' drops from 0.66 to 0.56, but is still double the 'shots per dump-in'. One argument that I think could be valid is the idea of dumping the puck in when you feel you can't carry it in. This wouldn't result in a failed entry, but would result in a dump-in. The issue with that argument, is that the average team had 2237 carry-ins, and 2645 dump-ins, so it's not like there's a notable difference in volume (which could account for the difference in shots being twice as prominent for carry-ins).

I also looked at the correlation between failed entries and opponents shots from entries, and found no correlation (an r^2 of 1.6%).

Instead of "all teams should dump less because league wide dumping in more doesn't correlate with more possession" it should be "line 3 has a retrieval rate of x and a carry in success rate of y, with an attempt ratio of r:s resulting in a CF of.. etc etc.

Real useful stuff that can aid in game planning.

I completely agree with that. There are certainly lines/players that can be more successful than others at 'dumping and chasing', but you also shouldn't fill up your team with those type of players, and 'Dump and Chase' shouldn't be the prevailing team philosophy.

One of my biggest problems with statistics in hockey is that I think to much of the emphasis has been on developing "truths" league wide using flawed data in epidemiological styled macro research. All lot is being ignored because it doesn't show up across the whole forest, even if its blatantly visible in the tree. The tree is dismissed as too small of sample size, when what it is is a controlled environment with more variables held equal

I'm not really sure what you mean. Are you talking about the importance placed on individual plays compared to the aggregate result? If so, a player can make a bad play and still be a good player. If you're suggesting that goals should be taken more seriously despite their complete lack of reliability, then I completely disagree. If a statistic isn't repeatable, then it's not really indicative of a player's ability, unless you also believe that a player's overall skill/ability significantly improves/regress' from season-to-season (game-to-game; moment-to-moment). Also, micro (ie. zone data, puck recoveries, passes, possession etc) events tend to have a significantly larger sample than macro events (ie. goals).
 

91Kadri91*

Guest
Thanks for putting this thread together.

Still strange how the mere mention of certain stats immediately leads to straw men and overly aggressive responses (which is why the ignore list function of the forum comes in handy).

Anyways, Maple Leafs Hot Stoves's scoring chance tracking project in particular has been an awful lot offen following - it's just a shame that the official NHL stat site is so inaccurate - Places like War on Ice are still so much better, though I really do miss Extra Skater.

Good call, that totally slipped my mind.

I'll add it to the OP.
 

4thline

Registered User
Jul 18, 2014
14,390
9,712
Waterloo
I'm not really sure what you mean. Are you talking about the importance placed on individual plays compared to the aggregate result? If so, a player can make a bad play and still be a good player. If you're suggesting that goals should be taken more seriously despite their complete lack of reliability, then I completely disagree. If a statistic isn't repeatable, then it's not really indicative of a player's ability, unless you also believe that a player's overall skill/ability significantly improves/regress' from season-to-season (game-to-game; moment-to-moment). Also, micro (ie. zone data, puck recoveries, passes, possession etc) events tend to have a significantly larger sample than macro events (ie. goals).

Gonna reply quick but I'd love to get into more depth later, finance final in 16 hours :laugh:.
Basically i think that the repeat-ability of certain things is quite understated by the constant flux that the league is in. Example, on-ice sv%, sh%, quality of competition. I think its players impact it more than large scale league wide data shows, because literally nothing is held constant. I think that If you could line up the same two teams of "prime" (not developing) 80 games in a row holding line combos and systems constant and run permutations of different matchups against each other clear and significant trends would appear in all of the above + possession statistics. Now of course, thats a crazy situation, and you'd never get data that good in real conditions, rendering those statistics useless for large scale league wide prediction. However, I think its folly for a team to dismiss what's happening as "random" and not make use of data because it gets obscured by noise in a less controlled setting (league wide, multi year data).

The analogy I would make is a doctor ignoring blood chemistry results of their particular patient because large scale epidemiological research with poor suggests that what they're seeing shouldn't be repeatable.
 

Ad

Upcoming events

Ad

Ad