On hockey and Elo ratings

morehockeystats

Unusual hockey stats
Dec 13, 2016
617
296
Columbus
morehockeystats.com
I ran the Elo predictions for the playoff series since 1988 through 2016.
Scores - amount of exact series outcome predictions
Winners - amount of correct winner predictions
Missed - amount of missing on the winner predictions.

Season: 1988 Scores: 3 Winners: 9 Missed: 3
Season: 1989 Scores: 2 Winners: 11 Missed: 2
Season: 1990 Scores: 1 Winners: 8 Missed: 6
Season: 1991 Scores: 3 Winners: 5 Missed: 7
Season: 1992 Scores: 4 Winners: 8 Missed: 3
Season: 1993 Scores: 3 Winners: 4 Missed: 8
Season: 1994 Scores: 4 Winners: 5 Missed: 6
Season: 1995 Scores: 3 Winners: 5 Missed: 7
Season: 1996 Scores: 3 Winners: 8 Missed: 4
Season: 1997 Scores: 3 Winners: 5 Missed: 7
Season: 1998 Scores: 2 Winners: 7 Missed: 6
Season: 1999 Scores: 3 Winners: 9 Missed: 3
Season: 2000 Scores: 1 Winners: 7 Missed: 7
Season: 2001 Scores: 3 Winners: 7 Missed: 5
Season: 2002 Scores: 3 Winners: 5 Missed: 7
Season: 2003 Scores: 5 Winners: 6 Missed: 4
Season: 2004 Scores: 7 Winners: 4 Missed: 4
Season: 2006 Scores: 2 Winners: 7 Missed: 6
Season: 2007 Scores: 3 Winners: 5 Missed: 7
Season: 2008 Scores: 3 Winners: 7 Missed: 5
Season: 2009 Scores: 4 Winners: 7 Missed: 4
Season: 2010 Scores: 2 Winners: 9 Missed: 4
Season: 2011 Scores: 3 Winners: 6 Missed: 6
Season: 2012 Scores: 3 Winners: 8 Missed: 4
Season: 2013 Scores: 4 Winners: 5 Missed: 6
Season: 2014 Scores: 6 Winners: 5 Missed: 4
Season: 2015 Scores: 3 Winners: 5 Missed: 7
Season: 2016 Scores: 3 Winners: 9 Missed: 3


Over 420 series (28 seasons X 15 series) in total, the model predicted 66% winners correctly (275). Remarkable is that in the wild 2012 (8th-placed Kings defeated 6-th placed Devils in the finals) it got 11 out of 15 correctly. Only once less than half was predicted correctly (7 out of 15 in 1993). The highest level was in 1989 (13 out of 15), but in the last one it was pretty decent with 12 out of 15. Highest level of prediction of the exact score was 7 out of 15 in 2004.

Soon to come to the Twitter, to my blog, and finally to my website.
 

MNNumbers

HFBoards Sponsor
Sponsor
Nov 17, 2011
7,658
2,536
Bi-weekly Bradley-Terry statistical model for NHL Power Rankings. Sunday, Jan 22.

Remember, this model calculates a Power Ranking for each team, such that the odds of that team winning a game with a different team are:

(PowerRank Team A)/(PowerRank Team B + PowerRank Team A).

And, since NHL has non-standard wins/game (The average game gives out 2.25 pts), I have normalized for that.

These Rankings can be used to calculate, using only the Rankings of the Teams and the Schedule of Games already played, the current point totals of all teams. In this sense, it is the perfect mathematical model of the season played to date.

The Rankings do NOT, however, hold perfect predictive value, since hockey is a game of puck luck, and also results are highly dependent on goaltending.

The Rankings:

Atlantic:
Mont 139
Ott 122
Tor 94
Bos 82
Buf 81
Det 80
TBL 79
Flo 78

Metro
Cmb 194
Wash 192
Pitt 174
NYR 129
Car 94
NYI 87
Phi 87
NJD 80

Cent
Min 148
Chi 127
StL 92
Nsh 87
Dal 70
Wpg 67
Col 37

Pac
SJS 127
Ana 114
Edm 107
LAK 85
Cgy 77
Van 76
Arz 46


Comments:
Generally, the weakness of Col and Arz pulls the West down because they play them more.
Also, it would seem that Ottawa has played a more difficult sched than Toronto thus far.
 
Last edited:

MNNumbers

HFBoards Sponsor
Sponsor
Nov 17, 2011
7,658
2,536
There is no better stat of schedule strength that the Buchholz coefficient:
http://morehockeystats.com/teams/buchberg

To quote the wiki article linked above:

The major criticism of this system is that tie-break scores can be distorted by the set of opponents that each player plays (especially in early rounds). To avoid this problem a version of Buchholz, the Median-Buchholz System is sometimes used. In the Median-Buchholz System the best and worst scores of a player's opponents are discarded, and the remaining scores summed.


Edit to add:
If the discussion is about strength of Schedule, it's clear that Ottawa must have played a more difficult schedule that Toronto. Forthwith:
Toronto has a combined 4 games against Arz/Col, while Ottawa has 1.
Ottawa has a combined 11 games against Ana/SJS/Min/Cmb/Was/Pit. Toronto has 8.
Since those teams are the outliers, and Toronto has faced the more advantageous in both the worst and the best, it follows qualitatively that Ottawa should have a higher power ranking than Toronto. All measuring systems should quantify that.
 
Last edited:

morehockeystats

Unusual hockey stats
Dec 13, 2016
617
296
Columbus
morehockeystats.com
To quote the wiki article linked above:

The major criticism of this system is that tie-break scores can be distorted by the set of opponents that each player plays (especially in early rounds). To avoid this problem a version of Buchholz, the Median-Buchholz System is sometimes used. In the Median-Buchholz System the best and worst scores of a player's opponents are discarded, and the remaining scores summed.

The criticism is not applicable to this case, because it refers to a Swiss-System tournament, or to another tournament system where some teams do not play each other at all (e.g. NFL), and even then - as a tie break, not as a in-season schedule strength indicator. It's definitely applicable even as a tie-break within division.
 

morehockeystats

Unusual hockey stats
Dec 13, 2016
617
296
Columbus
morehockeystats.com
Since those teams are the outliers, and Toronto has faced the more advantageous in both the worst and the best, it follows qualitatively that Ottawa should have a higher power ranking than Toronto. All measuring systems should quantify that.

In Elo projections it does not need to be reflected because the remainder of the opposition is going to be weaker for OTT than for TOR, therefore the expected score for OTT is going to be higher.
 

MNNumbers

HFBoards Sponsor
Sponsor
Nov 17, 2011
7,658
2,536
In Elo projections it does not need to be reflected because the remainder of the opposition is going to be weaker for OTT than for TOR, therefore the expected score for OTT is going to be higher.

But would be reflected in the current Elo, correct?
 

MNNumbers

HFBoards Sponsor
Sponsor
Nov 17, 2011
7,658
2,536
The criticism is not applicable to this case, because it refers to a Swiss-System tournament, or to another tournament system where some teams do not play each other at all (e.g. NFL), and even then - as a tie break, not as a in-season schedule strength indicator. It's definitely applicable even as a tie-break within division.

Again, not quite understanding the math here. The explanation on the wiki page seems to require that all contestants have played the same number of rounds. Is that correct?
 

morehockeystats

Unusual hockey stats
Dec 13, 2016
617
296
Columbus
morehockeystats.com
Again, not quite understanding the math here. The explanation on the wiki page seems to require that all contestants have played the same number of rounds. Is that correct?

For tiebreak purposes only.

For an uneven flow, like the NHL, I sum not the points, but the PPG of each team's opponents. Then I divide that number by the number of games the team played.
 

morehockeystats

Unusual hockey stats
Dec 13, 2016
617
296
Columbus
morehockeystats.com
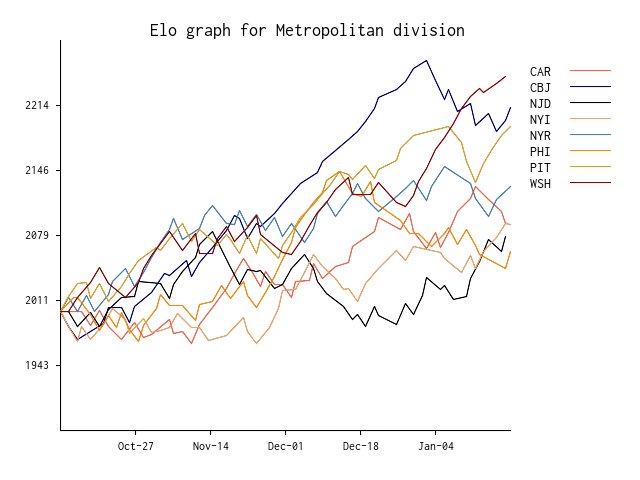
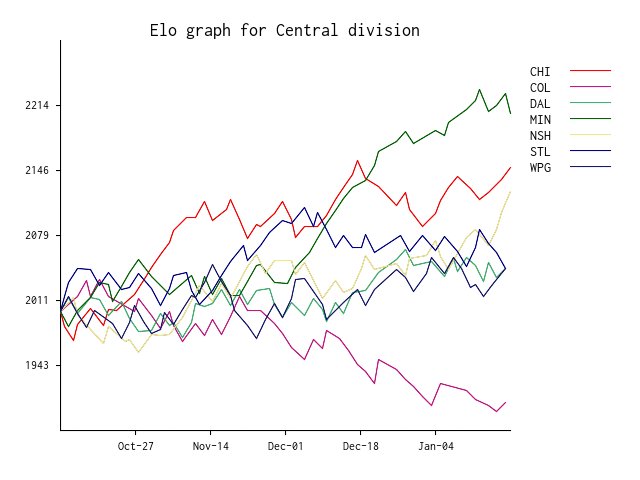
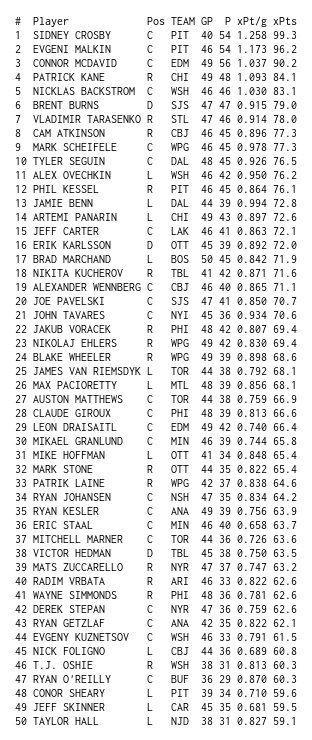
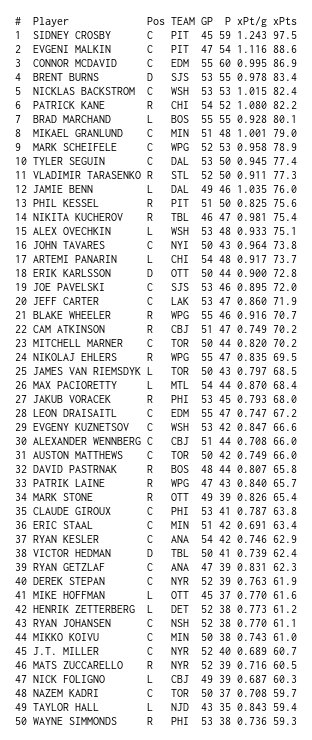
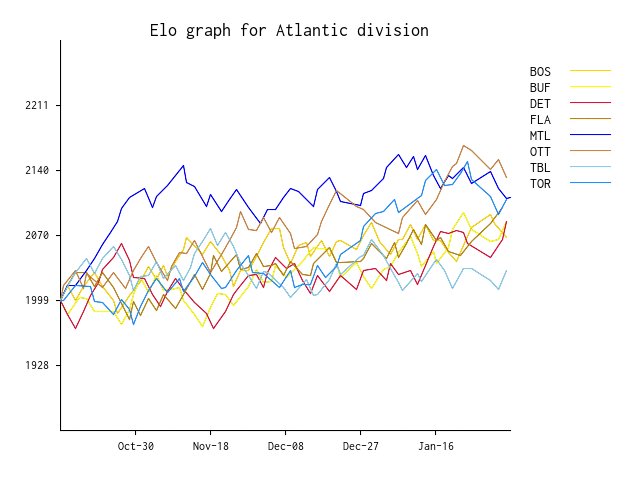
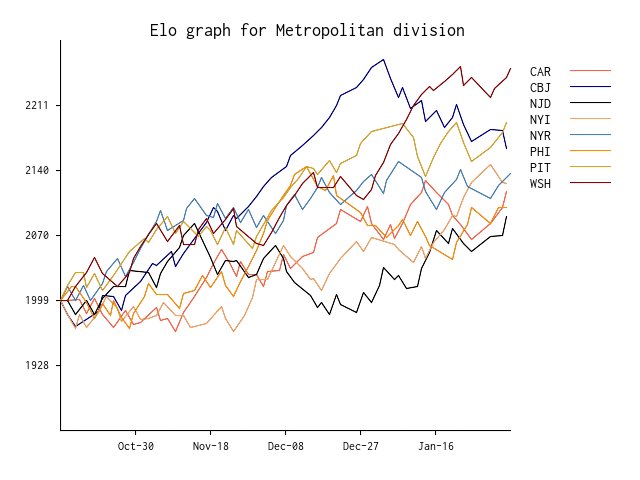
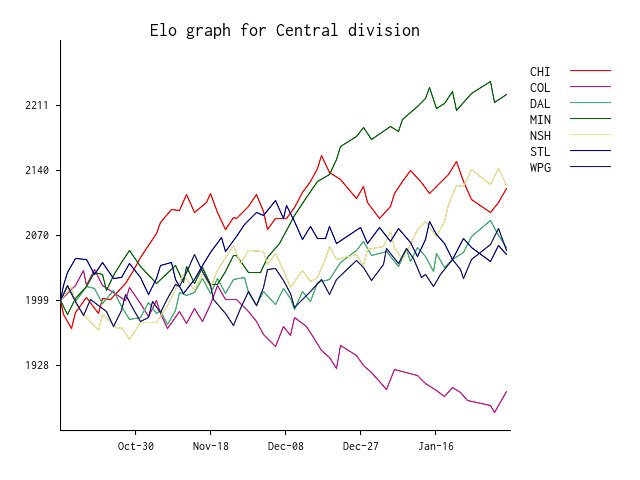
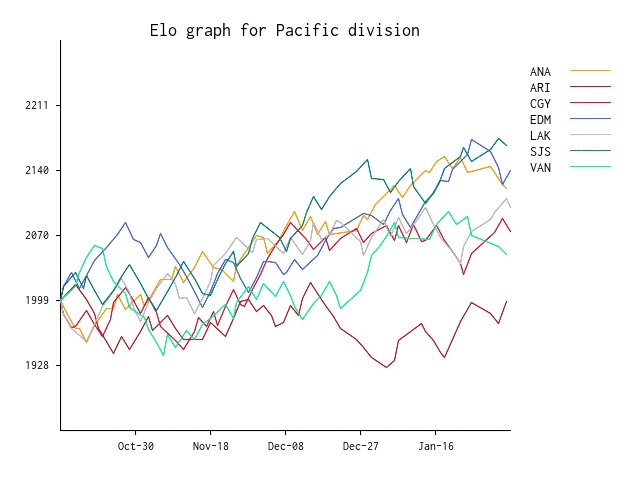
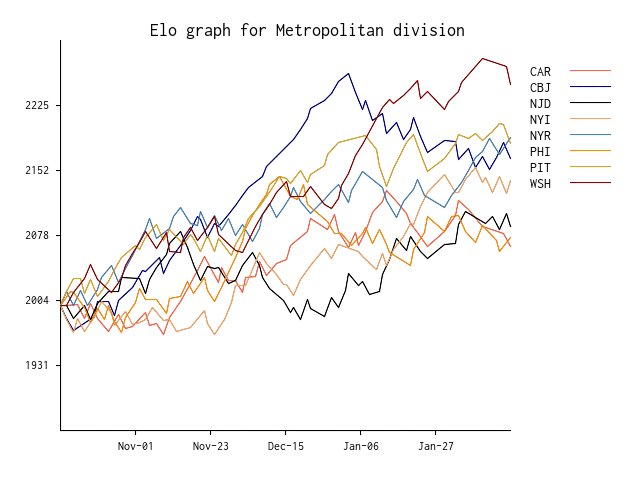
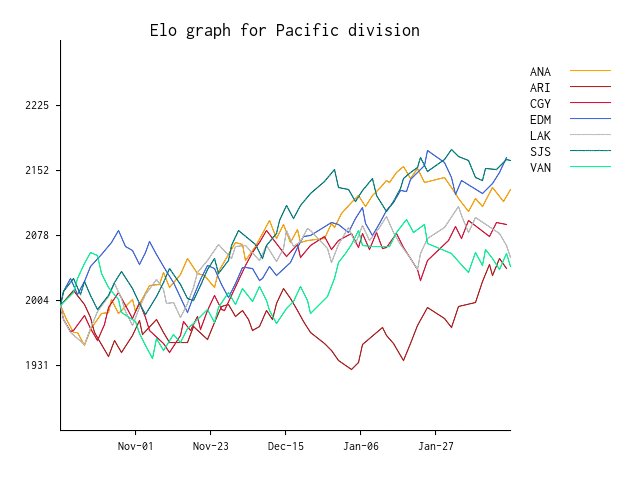
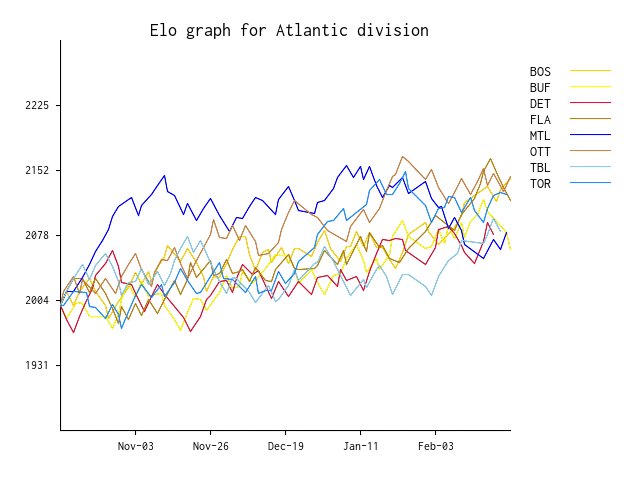
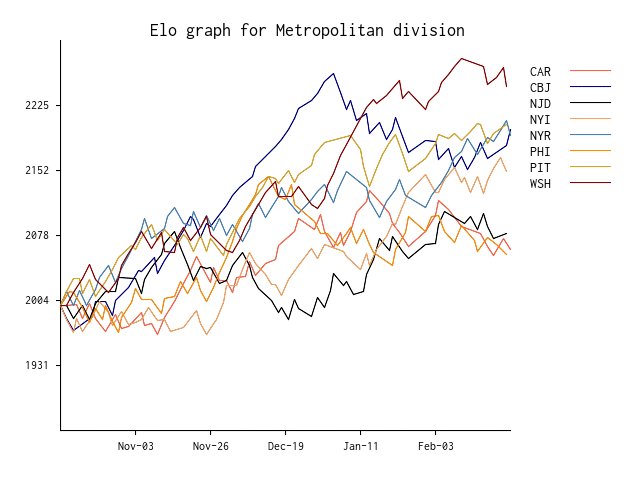
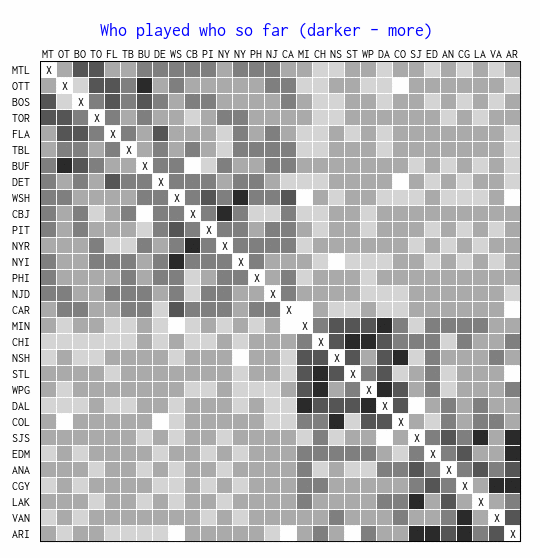
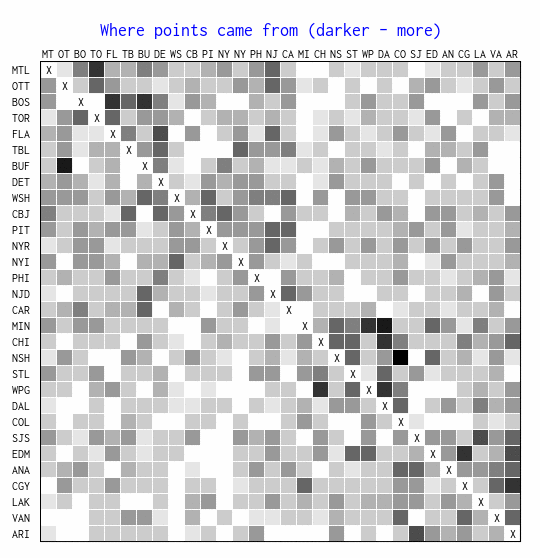
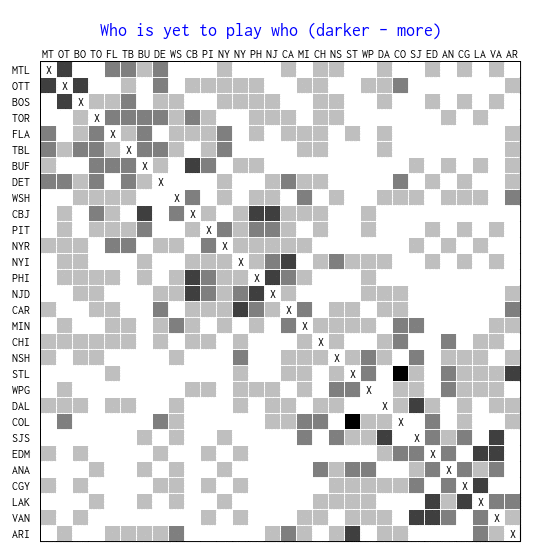
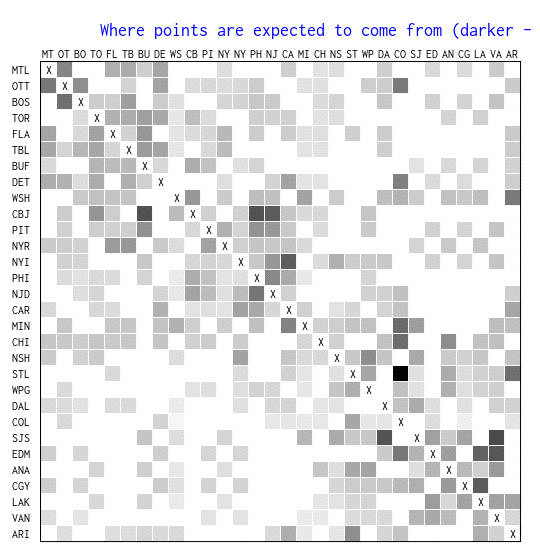
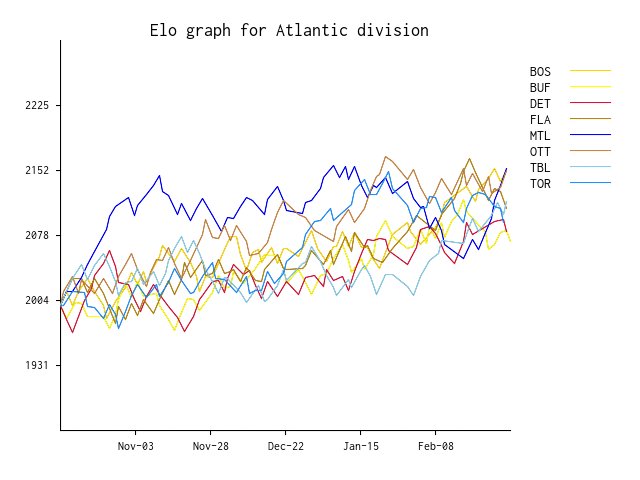
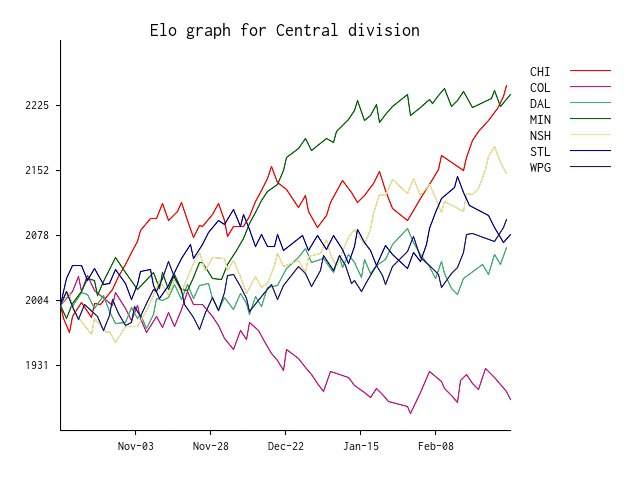
Team Elo graphs:
C23PxeeVIAIOzHI.jpg

C23PyEzUQAAweru.jpg

C23PyXyUcAExGpe.jpg

C23PxrNVQAA06QO.jpg
 

morehockeystats

Unusual hockey stats
Dec 13, 2016
617
296
Columbus
morehockeystats.com
In 2014 I tinkered with ELO, and related it to Corsi.
http://hfboards.mandatory.com/showthread.php?t=1729959&highlight=

Here is a link that discussed ELO related to Corsi focused solely on the Oilers.
http://hfboards.mandatory.com/showthread.php?t=1731745&highlight=

Here is a link that discussed ELO to rank faceoffs only.
http://hfboards.mandatory.com/showthread.php?t=1723255&highlight=

I'll see if I can dust off my work and update it.

I did detailed faceoff stats and Elo:
http://morehockeystats.com/players/faceoffratings
 

Ad

Upcoming events

Ad

Ad