NHL EDGE - New tool to evaluate players

Milhouse40

Registered User
Aug 19, 2010
22,113
24,690
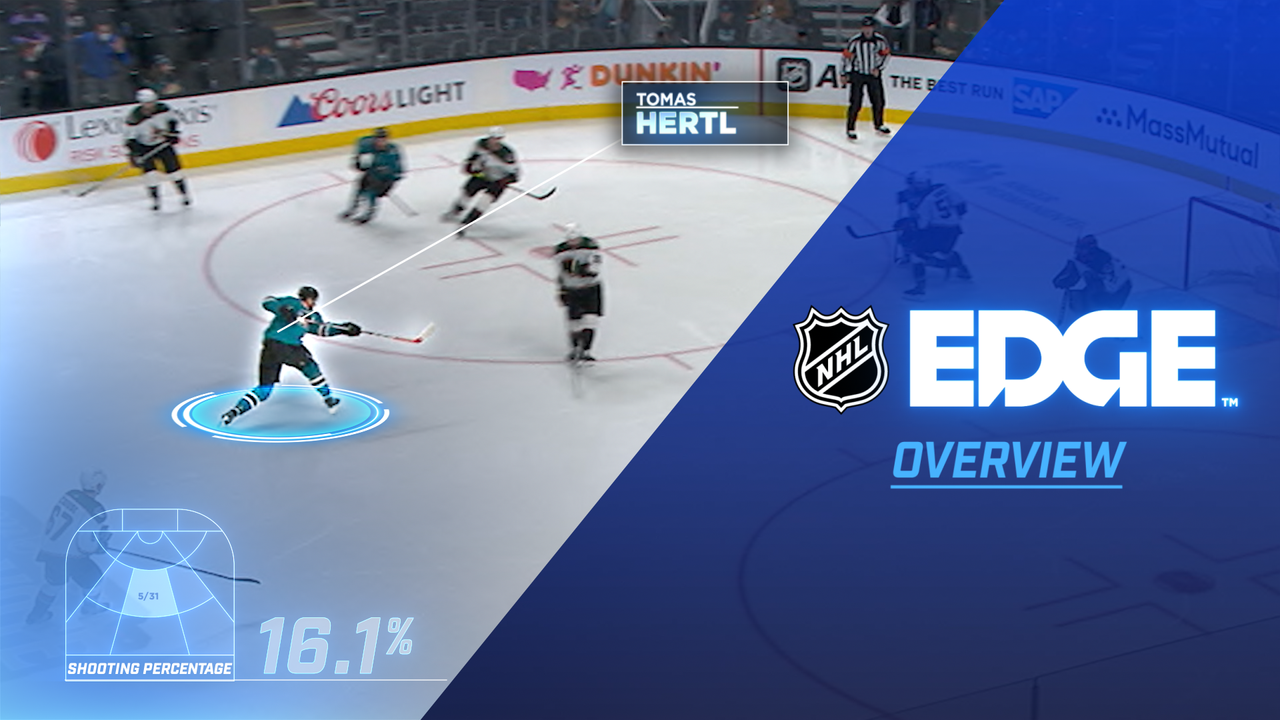
It's new from the NHL site.

A new tool with in evaluation of players


I'm sure it will come handy in times.....


Either it's Slafkovsky skating speed
1698074175005.png


Or from where Caufield scores his goals
1698074261458.png


Can also do some comparaison of players
1698074575062.png
 

Toene

Y'en aura pas de facile
Nov 17, 2014
4,960
4,932
The website is obviously pure cancer, can't load shit. Not surprised since nhl.com is one of the worst professional websites I've ever browsed.
 
  • Like
Reactions: The Gr8 Dane

Habs Halifax

Loyal Habs Fan
Jul 11, 2016
68,207
25,961
East Coast
Love seeing new stuff like this but as always, you have to take it with a grain of salt most of the time. Tells you where the player is today based on the past but it doesn't really tell you where the player is going in the future. That's all about obsession to improve which is hard to predict.
 

morhilane

Registered User
Feb 28, 2021
6,505
8,519
Love seeing new stuff like this but as always, you have to take it with a grain of salt most of the time. Tells you where the player is today based on the past but it doesn't really tell you where the player is going in the future. That's all about obsession to improve which is hard to predict.
The current stats are basically:
- skate fast or not
- move a lot or not
- good shooter or not
- good at keeping/getting the puck in the ozone or not

I find the ozone time and skating distance the most interesting of the stats. I wish they set the ozone start% along the ozone time thought. You can spend a lots of time in the ozone because you are (or your linemates) are good at keep the puck there, or because you always start there...

The shooting graph with the zones is interesting too. Tells you if a player goes into the paying area to shoot or not and how often (once it has more data over the season).
 

Habs Halifax

Loyal Habs Fan
Jul 11, 2016
68,207
25,961
East Coast
The current stats are basically:
- skate fast or not
- move a lot or not
- good shooter or not
- good at keeping/getting the puck in the ozone or not

I find the ozone time and skating distance the most interesting of the stats. I wish they set the ozone start% along the ozone time thought. You can spend a lots of time in the ozone because you are (or your linemates) are good at keep the puck there, or because you always start there...

The shooting graph with the zones is interesting too. Tells you if a player goes into the paying area to shoot or not and how often (once it has more data over the season).

Good stuff.

One area to dig into is how the numbers change for a guy like Bunting. How does it change when he's playing in the Leafs top 6 vs bottom 6 and then how does it change with the Canes this season.

A lot of fans are going to use these stats incorrectly IMO.

Those stats will be probably a lot more interesting after 25 games.......but, for the fun of it

View attachment 756663

How does it work? The larger the radius or surface area, the better the player is?
 

morhilane

Registered User
Feb 28, 2021
6,505
8,519
Good stuff.

One area to dig into is how the numbers change for a guy like Bunting. How does it change when he's playing in the Leafs top 6 vs bottom 6 and then how does it change with the Canes this season.

A lot of fans are going to use these stats incorrectly IMO.
The better usage is basically to compare with linemates/teammates to see who is doing what on a line (or at D). Too bad you can't set a timeframe (yet), we could look at the improvements, especially for the shots quality ( for -offense- and against - defense-).

The goalie section is great thought, the data makes it easier to split goalie performance with weak and strong D with all the chance types displayed. You can even extrapolate goalie/team weak side with it (which might lead to team correcting/finding them faster, they must have access to the same data).

You still need to to look at other stats to contextualize properly some of the ones presented there thought.
 
  • Like
Reactions: Habs Halifax

morhilane

Registered User
Feb 28, 2021
6,505
8,519
You can compare a player to himself from a previous season.

Slaf skate faster this year and his shot average shot speed might be higher too (not a lot of shots to compare so far thought).
 
  • Like
Reactions: Faterson

Lshap

Hardline Moderate
Jun 6, 2011
27,396
25,275
Montreal
How does it work? The larger the radius or surface area, the better the player is?
Based on the Caufield/Slafkovsky graph, it looks like the further out the point extends, the better. Caufield's points for Goals, SH%, and SOG are at the edge of the circle, or close to it. That makes him excellent in those areas.
 
  • Like
Reactions: Habs Halifax

morhilane

Registered User
Feb 28, 2021
6,505
8,519
How does it work? The larger the radius or surface area, the better the player is?
Short answer: yes.

Long answer: the graph is the various stats labelled at the edge as that player's rank in percentile in the league for it. So the closer to the edge the dot, the better that player is in the league. Note that the graph doesn't account for TOI when it comes to skating distance, it use the season cumulative value.
 
  • Like
Reactions: Habs Halifax

Hope Of Glory

Registered User
May 24, 2009
4,975
2,387
North Shore
We literally talked about the similar tool Liiga has in the Draft Thread this week. Was wondering when we would have it, about time.

Really interesting stuff.

The data seems to be available for the last 2 years or so. Has anyone (poster, journalist, twitter expert, wtv) back-tested some of the parameters yet to see if it holds any projecting value?
 

Scriptor

Registered User
Jan 1, 2014
7,810
4,779
I don't see the need for a new tool to evaluate NHL talent when so many tools are already contributing on them Internets...
 

Ad

Upcoming events

  • Inter Milan vs Torino
    Inter Milan vs Torino
    Wagers: 5
    Staked: $2,752.00
    Event closes
    • Updated:
  • Metz vs Lille
    Metz vs Lille
    Wagers: 3
    Staked: $354.00
    Event closes
    • Updated:
  • Cádiz vs Mallorca
    Cádiz vs Mallorca
    Wagers: 3
    Staked: $340.00
    Event closes
    • Updated:
  • Bologna vs Udinese
    Bologna vs Udinese
    Wagers: 4
    Staked: $365.00
    Event closes
    • Updated:
  • Clermont Foot vs Reims
    Clermont Foot vs Reims
    Wagers: 1
    Staked: $15.00
    Event closes
    • Updated:

Ad

Ad