garret9
AKA#VitoCorrelationi
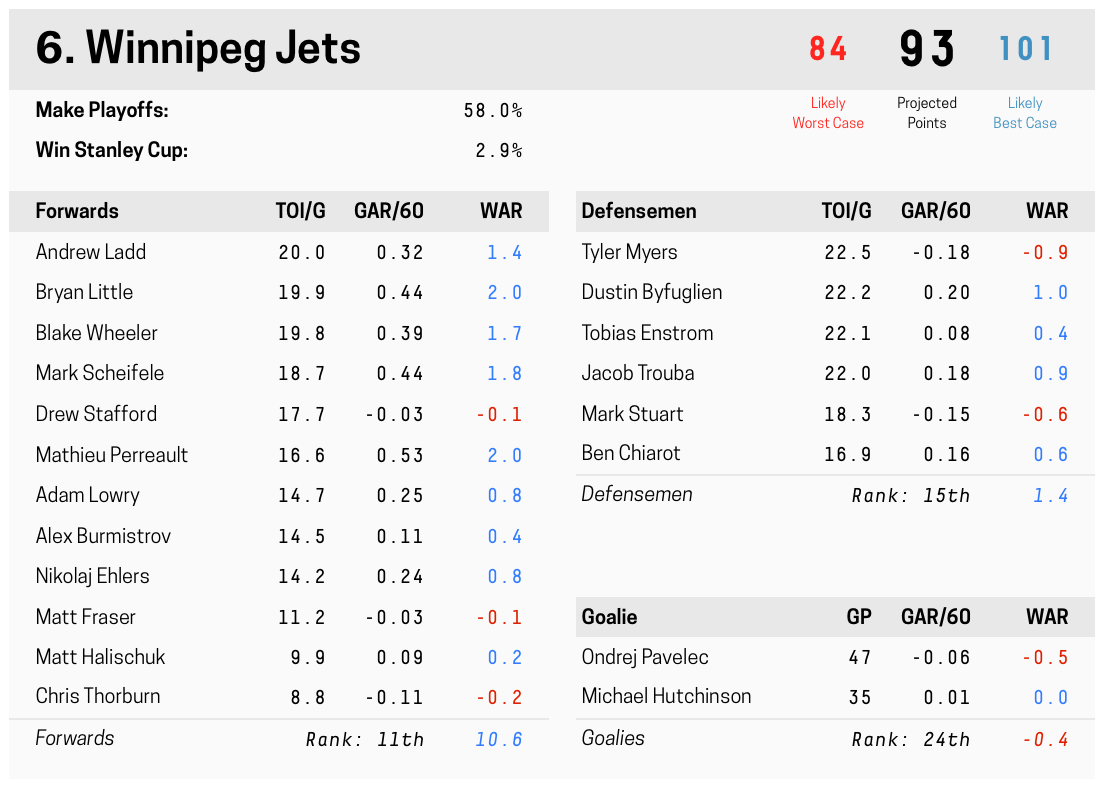
Jets Nations By The Numbers Profiles
Forwards
Andrew Ladd
Bryan Little
Blake Wheeler
Mathieu Perreault
Mark Scheifeile
Drew Stafford
Alex Burmistrov
Adam Lowry
Chris Thorburn
Matt Halischuk
Anthony Peluso
Matt Fraser
Patrice Cormier
Defenders
Tobias Enstrom
Jacob Trouba
Ben Chiarot
Dustin Byfuglien
Mark Stuart
Tyler Myers
Grant Clitsome
Paul Postma
Jay Harrison
Adam Pardy
Best on Special Teams
Forwards on Power Play
Defenders on Power Play
Forwards on Penalty Kill
Last edited: