Oilers analytic/advanced stat thread

Aceboogie

Registered User
Aug 25, 2012
32,649
3,896
There is year to year variation in ALL underlying stats which affects other stats... hence the difficulty of stating anything in absolute black and white terms when trying to come up with a definitive factor that absolutely states that player A is better than player B.

100% agreed, all have variation but GF% has more than others. High GF% with high PDO, or the opposite, really scares me. Screams regression and happens majority of the time the next season. It's like being highly leveraged in the stock market

Although again, it's a valuable indicator. You always want high GF% for players on your team
 
Last edited:

Tad Mikowsky

Only Droods
Sponsor
Jun 30, 2008
20,857
21,558
Edmonton
I really love what Woodguy and OilersNerdAlert have done with PuckIQ.

I am a firm believer that quality of competition really matters and that site helps me out.
 

Stoneman89

Registered User
Feb 8, 2008
27,464
21,916
I didn't say any of this.
At all.
Why so defensive?
Calm down.
Do you believe they are incapable of mistakes? Am I not allowed an opinion?

And I never said that the coach and GM have never made a mistake. (Reinhardt says hi to all of us). I just get tired of the seemingly constant piling on of one guy on here.
 

Aceboogie

Registered User
Aug 25, 2012
32,649
3,896
I really love what Woodguy and OilersNerdAlert have done with PuckIQ.

I am a firm believer that quality of competition really matters and that site helps me out.

Quality of teammate too, but this often gets ignored a ton. QoC and QoT can have similar impacts but often only QoC is focused on
 

Aceboogie

Registered User
Aug 25, 2012
32,649
3,896
Interesting new stat coming up: Game score. Not sure on all the specifics of it but it goes on a game by game basis and how they player did in said game. Not sure if inputs are goals/points and in different situations (game tying, game winner) and shot metrics or what, also doesnt factor in usage. Ill post when more comes out. So this is simply for entertainment sake. Here is the Oilers D core.

DFhW_QCWsAADkbB.jpg


It actually tracks pretty much to how each players season went. Klefbom/Larsson came out well, then had a meh stretch game 255-50 then played unreal as a pair game 50-75. All Oilers D contributed positively and it was D by committee

All credit to @dtmaboutheart
 

McDNicks17

Moderator
Jul 1, 2010
41,685
30,147
Ontario
When looking at the Oilers forward graph, I think the chart's lack of usage and (I'm assuming) the use of relative stats makes a guy like Letestu look far worse than he was.
 

Aceboogie

Registered User
Aug 25, 2012
32,649
3,896
When looking at the Oilers forward graph, I think the chart's lack of usage and (I'm assuming) the use of relative stats makes a guy like Letestu look far worse than he was.

Very true. That is why I am interested to see the inputs. If it is mostly shot metrics with no usage accounted for then I could see how Letestu looks worse. But id be curious to see how Puljujarvi comes out lower considering how he had great shot metrics. Letestu should come out good when looking at goals in different situations. he helped out big there

DFhW-pgWAAAwxTL.jpg


I just like this idea for a stat based on game by game results because it measures actual impact on any given game. I would like to see something based around game winning goals/ points on game tying/winning plays

For example: when Oilers were down by 1 here is the points/60 for different players

McDavid- 3.8
Eberle- 2.92
Maroon-2.75
few other forwards
Sekera- 1.83

In tied situations Letestu ranks 4th on forward for points/60

Meanwhile, when down by 2+ (with game out of hand essentially):

Kassian had the highest pts/60 at 2.13 and Mcdavid came in a 7th. So McDavid dominated when we were tied or down by 1 and didnt do so well down by 2+. Eberle was also a big help when the game was close, didnt do much when game was out of hand

This is all kind of rambling tho and stuff I want to look into. I value how players contribute when game is on the line vs game is out of hand
 

McDraekke

5-14-6-1
Jan 19, 2006
2,853
397
Edmonton
Very true. That is why I am interested to see the inputs. If it is mostly shot metrics with no usage accounted for then I could see how Letestu looks worse. But id be curious to see how Puljujarvi comes out lower considering how he had great shot metrics. Letestu should come out good when looking at goals in different situations. he helped out big there

DFhW-pgWAAAwxTL.jpg


I just like this idea for a stat based on game by game results because it measures actual impact on any given game. I would like to see something based around game winning goals/ points on game tying/winning plays

For example: when Oilers were down by 1 here is the points/60 for different players

McDavid- 3.8
Eberle- 2.92
Maroon-2.75
few other forwards
Sekera- 1.83

In tied situations Letestu ranks 4th on forward for points/60

Meanwhile, when down by 2+ (with game out of hand essentially):

Kassian had the highest pts/60 at 2.13 and Mcdavid came in a 7th. So McDavid dominated when we were tied or down by 1 and didnt do so well down by 2+. Eberle was also a big help when the game was close, didnt do much when game was out of hand

This is all kind of rambling tho and stuff I want to look into. I value how players contribute when game is on the line vs game is out of hand

This would be nice to see, as I think it's a very important psychological difference, between playing with the lead, while tied or while losing.

I'd also like to know how this graph is determined... could really show the people who don't think McDavid is twice as good as Draisaitl (arguments in the Drai contract thread), that yes... yes he really is.
 

Aceboogie

Registered User
Aug 25, 2012
32,649
3,896
This would be nice to see, as I think it's a very important psychological difference, between playing with the lead, while tied or while losing.

I'd also like to know how this graph is determined... could really show the people who don't think McDavid is twice as good as Draisaitl (arguments in the Drai contract thread), that yes... yes he really is.

I wouldnt say twice as good but I would agree with significantly better than. Nearly every stat can show this. McDavid is next level for 99% of forwards in the NHL and Draisaitl is lucky to be by his side. I have LD in the Barkov category (ie very good young player and 1st liner with great upside but not elite forward yet)

LD is great and one of best PP players in the league, but McDavid is the most impactful players overall in the NHL

C9GZLQEXcAAxFmb.png
 

Tad Mikowsky

Only Droods
Sponsor
Jun 30, 2008
20,857
21,558
Edmonton
I wouldnt say twice as good but I would agree with significantly better than. Nearly every stat can show this. McDavid is next level for 99% of forwards in the NHL and Draisaitl is lucky to be by his side. I have LD in the Barkov category (ie very good young player and 1st liner with great upside but not elite forward yet)

LD is great and one of best PP players in the league, but McDavid is the most impactful players overall in the NHL

C9GZLQEXcAAxFmb.png

I have the same problem with this model as Jason Gregor does.

Faceoffs are a bonus category for only one position. Thus, in theory, Centre will always be graded higher than Wingers.

It wouldnt' make sense to give this category to say defencemen.
 

Aceboogie

Registered User
Aug 25, 2012
32,649
3,896
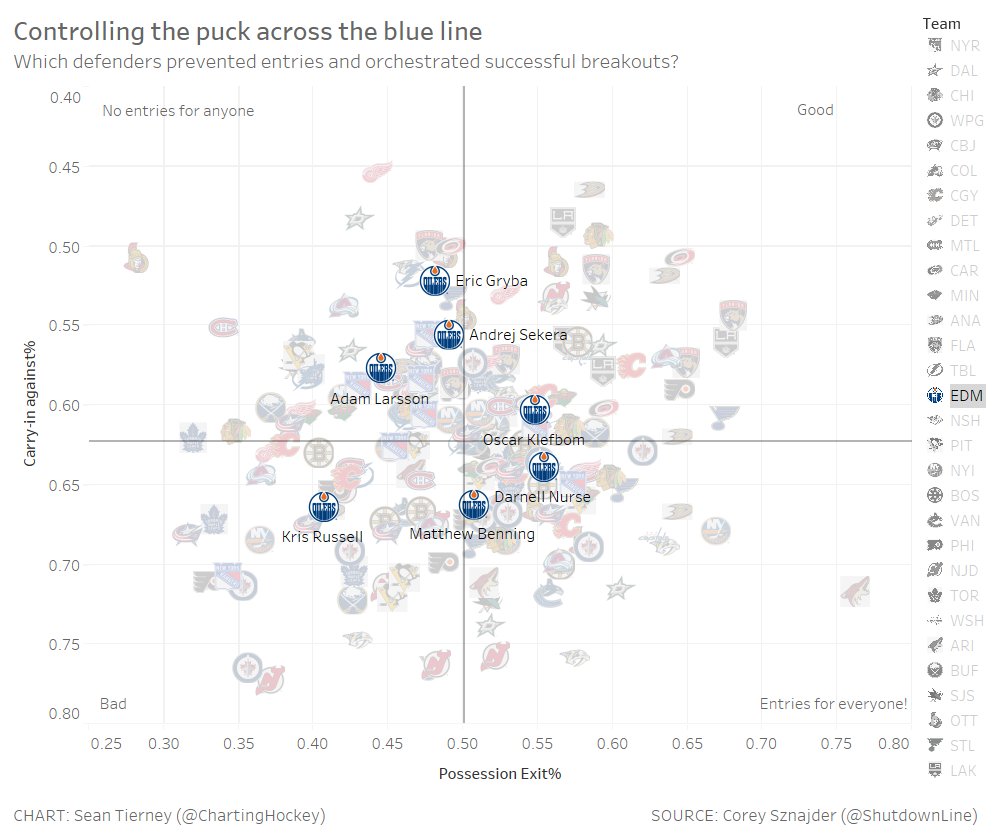
Moar zone exit/entry data. This graph combines zone entry preventation and zone exits for each D

DFh7CmJVoAQPr4a.jpg:large


Notes:

Nurse is really good at breaking the puck out and this has always been his strength. Say what you want about his IQ or whatever, dude can get the puck going the other way. Its no suprise to me that McDavids best offensive numbers come with Nurse. Nurse can hit McDavid in stride and can jump start a rush. I have no doubt well see this combo to continue to grow the next few years. If anyone remembers the 2015 WJC when Nurse was a zone exit beast theyll be drooling.

Klefbom shows well in both preventing zone exits and starting rushes. If anyone ever wonders why Klefbom possession stats are so good, this is the reason. Klefbom controls the blue line both defensively and offensively

Larsson fits his billing as a strong defensive player. Offensively struggles to exit the zone but thats why he defers to Klefbom so often. Usage taken into consideration, his zone entry prevention is great

Gryba- I got time for you on my team. While you are billed as a defense first player, you can still exit the zone well and contribute there

Sekera- better at preventing zone entries then I thought, although zone exit numbers a bit lower than I thought too

Benning- Very nice things from the rookie, he can move the puck. He can play well in his own end too, if he learns to defend the rush better hes going to be a beast. Muzzin-lite

Russell- No comment
 
Last edited:

Aceboogie

Registered User
Aug 25, 2012
32,649
3,896
I have the same problem with this model as Jason Gregor does.

Faceoffs are a bonus category for only one position. Thus, in theory, Centre will always be graded higher than Wingers.

It wouldnt' make sense to give this category to say defencemen.

I can see why this would be a problem, but isnt that why we value centers more than wingers? Predominantly the line of thinking is that faceoffs are so crucial to a game, so shouldnt we value those players capable of those faceoffs?

D are not included in this chart and I agree if they were faceoffs kind of skew things (even if they only make up a smaller % of total impact). I think it has value for comparing forwards including wingers and centers

On a side note: I love that GAR takes into account penalties draw/taken. This ability is severely overlooked when any analytic is brought up. Penalties swing a game and the ability to draw them or not take them should be valued. If a player sucks terribly for 2 minutes straight and causes his team to play in their own zone for that time, wed rightfully rip them apart. So a player who puts their team down a man should be equally crucified. GAR should take into account PK ability tho

Ofcourse, GAR is not the be all and end all stat. I just wanted to show how shoulders and tails above McDavid is. Any stat you want to look at will show this, GAR just has a handy chart for ease
 

Panda Bear

Registered User
Apr 2, 2010
6,587
5,724
Moar zone exit/entry data. This graph combines zone entry preventation and zone exits for each D

DFh7CmJVoAQPr4a.jpg:large


Notes:

Nurse is really good at breaking the puck out and this has always been his strength. Say what you want about his IQ or whatever, dude can get the puck going the other way. Its no suprise to me that McDavids best offensive numbers come with Nurse. Nurse can hit McDavid in stride and can jump start a rush. I have no doubt well see this combo to continue to grow the next few years. If anyone remembers the 2015 WJC when Nurse was a zone exit beast theyll be drooling.

Klefbom shows well in both preventing zone exits and starting rushes. If anyone ever wonders why Klefbom possession stats are so good, this is the reason. Klefbom controls the blue line both defensively and offensively

Larsson fits his billing as a strong defensive player. Offensively struggles to exit the zone but thats why he defers to Klefbom so often. Usage taken into consideration, his zone entry prevention is great
I would be interested to see a heatmap of where Larsson and Klefbom tend to 1) gain possession in their own zone, and 2) exit the zone with a controlled pass.

My suspicion is that Larsson is more prone to clearing the puck out along the boards or off the glass because he's the designated board battler for the pair.

Further, I suspect Klefbom tends to win the puck further up the ice than Larsson. Due to a combination of their skating and playstyles, Larsson tends to play quite a bit deeper than Klefbom. Since Klefbom has cover, he can afford to be more aggressive in challenging the puck carrier.

If the puck carrier is coming down the middle of the ice, it's almost always Klefbom who challenges.
 

Aceboogie

Registered User
Aug 25, 2012
32,649
3,896
I would be interested to see a heatmap of where Larsson and Klefbom tend to 1) gain possession in their own zone, and 2) exit the zone with a controlled pass.

My suspicion is that Larsson is more prone to clearing the puck out along the boards or off the glass because he's the designated board battler for the pair.

Further, I suspect Klefbom tends to win the puck further up the ice than Larsson. Due to a combination of their skating and playstyles, Larsson tends to play quite a bit deeper than Klefbom. Since Klefbom has cover, he can afford to be more aggressive in challenging the puck carrier.

If the puck carrier is coming down the middle of the ice, it's almost always Klefbom who challenges.

That's be cool to see

Also to note, by the stats wheatnoil tracked- Larsson loved to pass it D to D Klefbom in our end and Klefbom would then skate of pass it up and some of these entries were uncontested. Not sure how much of an overall impact this had but could boost Klefboms zone exit % and bit and hurt Larssons. But as a team we are better for it
 

Jesus Take the Wheel

Registered User
Jul 9, 2015
3,044
1,359
Edmonton
Interesting new stat coming up: Game score. Not sure on all the specifics of it but it goes on a game by game basis and how they player did in said game. Not sure if inputs are goals/points and in different situations (game tying, game winner) and shot metrics or what, also doesnt factor in usage. Ill post when more comes out. So this is simply for entertainment sake. Here is the Oilers D core.

DFhW_QCWsAADkbB.jpg


It actually tracks pretty much to how each players season went. Klefbom/Larsson came out well, then had a meh stretch game 255-50 then played unreal as a pair game 50-75. All Oilers D contributed positively and it was D by committee

All credit to @dtmaboutheart

This is obviously a different example I've seen for game score, but I'd assume the metrics that are used are similar? Dunno if that helps :dunno:

Player Game Score = (0.75 * G) + (0.7 * A1) + (0.55 * A2) + (0.075 * SOG) + (0.05 * BLK) + (0.15 * PD) - (0.15 * PT) + (0.01 * FOW) - (0.01 * FOL) + (0.05 * CF) - (0.05 * CA) + (0.15 * GF) - (0.15* GA)

PD and PT is penalty differential
 

Aceboogie

Registered User
Aug 25, 2012
32,649
3,896
This is obviously a different example I've seen for game score, but I'd assume the metrics that are used are similar? Dunno if that helps :dunno:

Player Game Score = (0.75 * G) + (0.7 * A1) + (0.55 * A2) + (0.075 * SOG) + (0.05 * BLK) + (0.15 * PD) - (0.15 * PT) + (0.01 * FOW) - (0.01 * FOL) + (0.05 * CF) - (0.05 * CA) + (0.15 * GF) - (0.15* GA)

PD and PT is penalty differential

Nice! thanks
 

Aceboogie

Registered User
Aug 25, 2012
32,649
3,896
For anyone who cares, this piece touches on GF% and CF% (well the piece rips into +/- but does touch on GF% to start). The most relevant piece is the predicting ability of GF% and CF%. GF% uses a smaller sample size (less goals than shots) so more open to variability and less predictive ability. If you are looking at any sort of analytic you either use it to look at what happened, or you use them to see what will happen in the future (which I value more). One of the best stats in expected goals (xG) as it takes into account type of shot

cqwg8jlwcaig8na.png


In the end, the predictive ability does get limited the further into the future you get
 

nexttothemoon

and again...
Jan 30, 2010
29,624
16,932
Northern AB
For anyone who cares, this piece touches on GF% and CF% (well the piece rips into +/- but does touch on GF% to start). The most relevant piece is the predicting ability of GF% and CF%. GF% uses a smaller sample size (less goals than shots) so more open to variability and less predictive ability. If you are looking at any sort of analytic you either use it to look at what happened, or you use them to see what will happen in the future (which I value more). One of the best stats in expected goals (xG) as it takes into account type of shot

cqwg8jlwcaig8na.png


In the end, the predictive ability does get limited the further into the future you get

So if I'm interpreting that correctly... on a team level (team stats comprised of 23+ individual players playing over the course of a year)... there is minimal predictive value when you are trying to forecast forward say 82 games which you'd be trying to do if you want to see how a team would do in their next season based on underlying stats.

Forecasting ahead a few games is more accurate but less useful because you want to know what is predictive over 82 games rather than 10-50.
 

Aceboogie

Registered User
Aug 25, 2012
32,649
3,896
So if I'm interpreting that correctly... on a team level (team stats comprised of 23+ individual players playing over the course of a year)... there is minimal predictive value when you are trying to forecast forward say 82 games which you'd be trying to do if you want to see how a team would do in their next season based on underlying stats.

Forecasting ahead a few games is more accurate but less useful because you want to know what is predictive over 82 games rather than 10-50.

Predicting 82 games into the future is largely a guessing game no matter what metric/tool/system you want to use. Too much variability with injuries/cold or hot stretches/ player movement etc

If you go look at any standings prediction from the start of any given year and compare to actual ending results, the accuracy is always drastically low

Even then, use expected goals (which is a shot metric with shot location taken into consideration), you still get more predicative ability at its very lowest then goal based metrics do at their peak. Peak ability of XG is more than double peak GF% predicitive ability
 

Aceboogie

Registered User
Aug 25, 2012
32,649
3,896
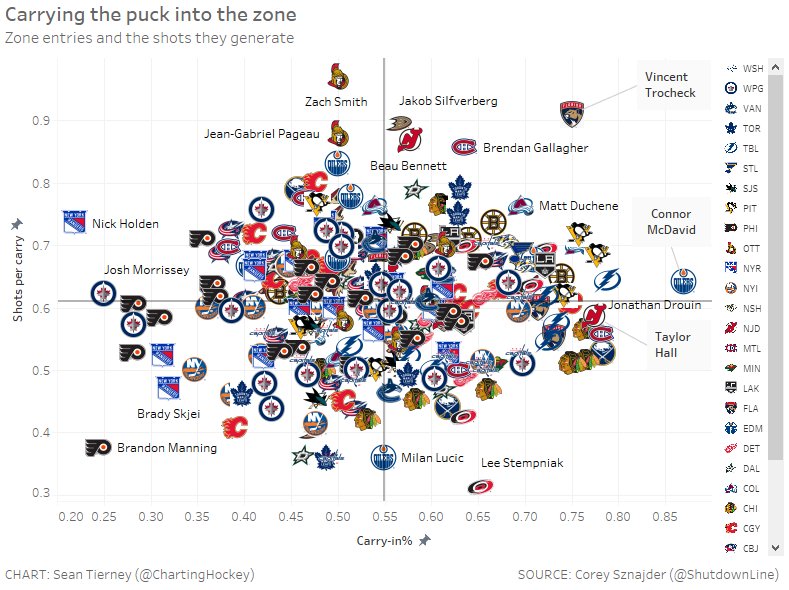
Here data on the forwards zone entrys and what rate they generate shots on those zone entries

-McDavid is incredible. He cant be stopped
- Imagine Hall and a healthy McDavid together (or on different lines). Dont turn this into a Hall trade thread
-Trocheck is the very top right, hes turning into an analytics GOAT (tongue in cheek). Shows up great in nearly every stat

DFqZm6OXcAAMnv5.jpg


DFqHdtlXcAANB6f.jpg


-Draisaitl comes out great (hes the unlabeled one)
-RNH is effective at getting shot on the rush, not as great on controlled entries. Lucic is the exact opposite
 

nightfighter

Registered User
Aug 31, 2008
2,017
139
Here data on the forwards zone entrys and what rate they generate shots on those zone entries

-McDavid is incredible. He cant be stopped
- Imagine Hall and a healthy McDavid together (or on different lines). Dont turn this into a Hall trade thread
-Trocheck is the very top right, hes turning into an analytics GOAT (tongue in cheek). Shows up great in nearly every stat

DFqZm6OXcAAMnv5.jpg


DFqHdtlXcAANB6f.jpg


-Draisaitl comes out great (hes the unlabeled one)
-RNH is effective at getting shot on the rush, not as great on controlled entries. Lucic is the exact opposite

Prime example actually of why Hall/Mcdavid never worked well together. Both like to carry it in and look for a pass.
 

Aceboogie

Registered User
Aug 25, 2012
32,649
3,896
Prime example actually of why Hall/Mcdavid never worked well together. Both like to carry it in and look for a pass.

Agreed, both were very good with the puck and needed to have it. Only one puck to go around. In an alternative world with both on 2 different lines tho... wed be in the offensive zone half the game.

Ideally Puljujarvi slots in around the Gallagher area as we need a pure shooter and shoot first player on this team
 

McDNicks17

Moderator
Jul 1, 2010
41,685
30,147
Ontario
It'd be cool if there was a version of that for dumping the puck in to get an idea for a player's forechecking.

Something like retrieval % and shots generated.
 

Ad

Upcoming events

Ad

Ad