
News Article: "Fun With Numbers" - Advanced Stats Talk Here
- Thread starter BonkTastic
- Start date
You are using an out of date browser. It may not display this or other websites correctly.
You should upgrade or use an alternative browser.
You should upgrade or use an alternative browser.

JungleBeat
Registered User
It’s not going to be fun anymore when Sh% comes down.We're leading the league in shot percentage?
Huh.
Do Make Say Think
& Yet & Yet
- Jun 26, 2007
- 51,209
- 9,962
We're leading the league in shot percentage?
Huh.
And by a considerable margin.
This is unfortunate.
solidprospect
Borveetzky
- Sep 30, 2017
- 4,422
- 1,274
Shooting percentage when the chart was made. I think it missed or didn't include several games from other teams last night. We're still #1 in shooting percentage 5 on 5 though.We're leading the league in shot percentage?
Huh.
BonkTastic
ಠ_ಠ
It’s not going to be fun anymore when Sh% comes down.
Yeah.
... yeah...
solidprospect
Borveetzky
- Sep 30, 2017
- 4,422
- 1,274
XGoals % Even strength sens rank 22nd vs a top 5 shooting percentage early on. We do probably fall back a bit eventually.
solidprospect
Borveetzky
- Sep 30, 2017
- 4,422
- 1,274
BondraTime
Registered User
So high shooting percentage and bad goaltending is fun?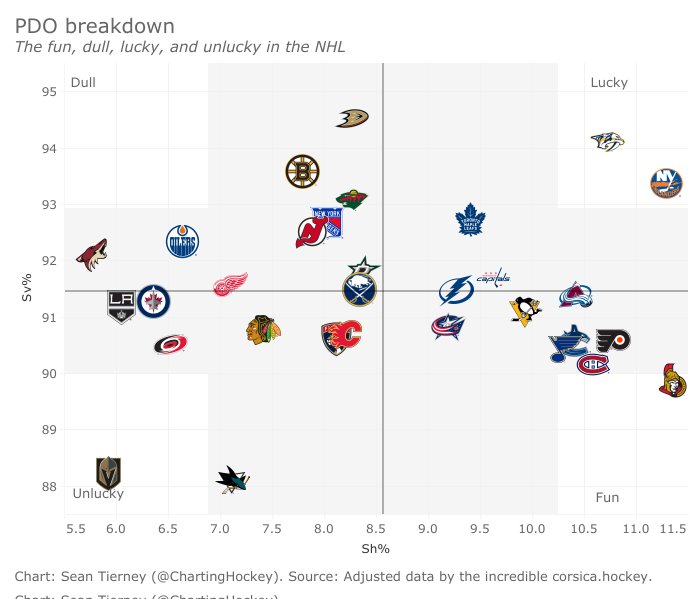
Still fun.
High shooting percentage and good goaltending is lucky?
solidprospect
Borveetzky
- Sep 30, 2017
- 4,422
- 1,274


solidprospect
Borveetzky
- Sep 30, 2017
- 4,422
- 1,274
We haven't had bad goal tending, but yes according to the chart creator.So high shooting percentage and bad goaltending is fun?
High shooting percentage and good goaltending is lucky?
solidprospect
Borveetzky
- Sep 30, 2017
- 4,422
- 1,274
NorthCoast
Registered User
- May 1, 2017
- 1,250
- 1,167
Dec 17, still fun
Well, EK is one of the league leaders for lowest shooting %...so there's your answer. That's how these things work right?
solidprospect
Borveetzky
- Sep 30, 2017
- 4,422
- 1,274
They have shot rate charts as well but that makes sense. Most of his shots are far from the net and relying on screens and tips. He's not really a sniper style of defenceman with a big one timer even though he taks alot of shots.Well, EK is one of the league leaders for lowest shooting %...so there's your answer. That's how these things work right?
MatchesMalone
Formerly Innocent Bystander
- Aug 29, 2010
- 1,612
- 1,071
I want to preface this by saying I am far from an analytics expert. I've never studied math or stats beyond the high school level, but I've been a fan of hockey stats since I was a kid, and have continued to keep a very rudimentary following of the advances in analytics over the years.
Earlier this year, in the process of trying to rank the best defensemen in the league, I decided I needed a lot more numbers to go off. I'm of the belief that corsi isn't nearly as useful for evaluating defensemen as it is for forwards. Corsi also only measures 5on5 stats, while special teams are such an important, and specific, part of the game.
So I went searching for some good stats for evaluating defensemen, and found three that I've ended up using a lot lately.
RelPPGF/60 – This stat measures how many more or less goals a team scores on the powerplay when a given player is on the ice than when he's not, per 60 minutes of powerplay time. I set it only for 5-4 PP, to keep things consistent.
When devising a new stat (I’m certain I’m not the first person to invent it, but I haven’t seen it in common use, and it wasn’t a stat that some site had ready-made, I just had the idea and put together some filters), you always want to check and make sure it passes the common sense test, and indeed, the top guys (minimum 50 PP mins) are basically the guys you’d expect to help a powerplay – Draisaitl, Marchand, Point, McDavid, Pastrnak are the top five. As a funny aside, I remember one article on advanced stats years ago talked about the “Pavel Datsyuk test”, as in if Pavel Datsyuk doesn’t rank well in it then you know it’s not a good stat.
The first surprise comes with Alex Chiasson at number ten, but this can largely be explained by him mostly playing with McDavid and Draisaitl on the PP; clearly McDavid and Draisaitl themselves are so high because the rest of the powerplay without them is utter garbage. So yeah, it is partly team dependent in a variety of ways, but overall I’m pretty happy with this stat.
On the other end of the spectrum, there are some surprises. Common sense test is satisfied to see guys like Lars Eller, Sven Andrighetto, Mikael Backlund and Dmitry Orlov in the bottom ten. But I wasn't expecting Charlie McAvoy, Kevin Shattenkirk and Tyler Johnson, although we can imagine some reasons they might be there.
RelSHGA/60 – Same idea as above. This stat measures how many more or less goals a team give up on the penalty kill when a given player is on the ice, per 60 minutes of PK time, specific to 4-5 PK.
This one is a little fuzzier on the common sense test. Penalty killing is a very specific skill that we don’t really have any mainstream stats to quantify besides plain SHTOI, and as much as I glorify TOI, of course coaches can get it wrong sometimes. Iterestingly, the teams who got this wrong and kept playing guys who struggle on the PK were almost universally non-playoff teams.
I would like to hope that this could become the first mainstream stat for evaluating individual performance on the penalty kill.
First looking at some of the worst ranked players (min 50 mins SH): Brian Gibbon ranked the worst; a career AHLer got stuck killing penalties on an awful team because most of the forwards were under 23 after the deadline. Darren Helm and Trocheck ranked 2nd and 9th worst. Maybe the coaches can be excused somewhat here because both guys are there for faceoff abilities and maybe to try to back off opponents with their speed or skill. Kesler ranked 3rd worst, he is there for faceoffs but is old and broken and the coach refused to make a change.
As for the top players in this stat, Charlie McAvoy redeems himself for his powerplay woes, ranking first in the league here. Next we have Ryan Johansen, Erik Cernak, Leo Komarov, Brandon Sutter, Valteri Filppula and Evander Kane. Again, penalty killing is a very specific skill, and until now we haven’t really had any stats to assess individual PK performance, so it is hard to know what to expect, but that all sounds reasonable to me.
Note that this stat is goals against, so a more negative number is better, meaning the player allowed less goals against compared to team average.
RelGF% - This stat measures what percent more or less of the goals a team scores at 5 on 5 when a given player is on the ice. So basically it is adjusted +/-. If a team, on average, scores 48% of the goals at even strength (and their opponents score 52%) and when a given player is on the ice, the team scores 50% of the goals, then that player is +2%. While this is a hell of a lot more useful than +/-, it still isn’t the greatest. Generally speaking, corsi is much more valuable, as luck plays more of a role in being on the ice for a goal scored for or against, as well as the quality of teammates and opponents; whereas an individual player can have more of an effect on driving possession. But as I said, I dont love corsi for valuing defenseman, and adjusted +/- can tell you a lot.
How does RelGF% do on the common sense test? Radulov ranks 1st, Tyler Seguin 4th, and Jamie Benn 14thin the league. When you have such a top-heavy team that relies so much on one elite line, and the rest of the team struggled through injuries and lack of depth, that top line is going to have to come through, and I think the fact that this team managed to make the playoffs is evidence enough that they did indeed come through. Also Teravainen and Aho are 5th and 12th - again, a hard-working, well-structured team that relies heavily on a couple of high-end skilled players. Demers and Copp ranked 2nd and 3rd, and I’m not entirely sure what to make of that. Call them underrated?
This is my least favorite of these stats I’m considering here, but I think it does have some value. Sidney Crosby ranks 7th, so that’s always a good sign.
Then if we look at the bottom ranking players (min 500 mins), everything looks in order. Dubinsky and Riley Nash rank 1st and 4th worst. The other side of the spectrum from Dallas - when you have such a stacked team as Columbus, and you have a couple players having some struggles, of course they’re going to rank poorly here, and Torts rightly played them on the 4th line, 12 and 10 mins a game respectively. Chandler Stephenson ranked 2nd worst, again a mediocre player on a top team. Jack Johnson ranked 11th worst, and any stat that makes Jack Johnson look bad gets bonus points in my book.
One issue with goal-based stats is they require pretty substantial samples to be very useful, or else Lady Luck will rear her ugly head. Corsi, on the other extreme, provides large samples, but I don't find terribly useful for special teams - simply taking shots (without accounting for quality of shot selection) on the PP can lead to loss of possession and/or zone.
So for supplemental stats I've been using relative PP scoring chances for and high danger chances for (RelPPSCF/60 and RelPPHDCF/60) for the powerplay, and relative SH scoring chances against and high danger chances against (RelSHSCA/60 and RelSHHDCA/60) for penalty killing.
Last edited:

MatchesMalone
Formerly Innocent Bystander
- Aug 29, 2010
- 1,612
- 1,071
The major thing that stood out for me looking over these metrics, is how drastically they justify veterans over U25s. I made up a list (not posting here) of 50 or so defensemen, split into vets and U25s, and the great majority of player on the U25 list have negative RelPPGF/60, and positive RelSHGA/60, while most of the top veterans are in the green for at least one if not both.
A lot of interesting things to note, but one that stood out to me is in Nashville it looks like Ellis and Ekholm have developed into some of the better defensemen in the league, and Subban was probably the fourth best defenseman on the team at this point, so the trade made a lot of sense. How does that team keep doing it? Timonen, Weber, Suter, Jones, Josi, Ellis, Eckholm...
Another general thing standing out is how many good defensemen are actually negative influences on the powerplay. I've thought of two possible explanations for this. One is that teams score more on the PP with more forwards on the ice. Most of the true elite defensemen are positive influences to their powerplays, so likely those are the guys who are usually the one forward out, but on the occasions where the coach uses two defensemen on the powerplay, it will be safer but less effective, and so that second defenseman brings down the average?
The other obvious explanation is that some of the defensemen are facing tougher quality of competition against teams' top PK units, and so compared to their team's other PP unit their numbers suffer. I'm currently in the process of figuring out how to deal with QOC on special teams, and making good progress thanks to corsica.hockey.
Just for fun, I threw together a top 10 and bottom 5 for each category, just amongst the defensemen on my list.
Top 10 RelGF% (vets)
- Jake Muzzin: 14.86%
- Kris Letang: 11.48%
- Duncan Keith: 11.01%
- Mark Giordano: 9.16%
- John Klingberg: 8.93%
- Brandon Montour: 8.29%
- Morgan Rielly: 8.09%
- John Carlson: 7.76%
- Torey Krug: 7.01%
- Jake Gardiner: 6.96%
- Colton Parayko: 6.94%
Top 5 RelGF% (U25)
- Thomas Chabot: 10.52%
- Brett Pesce: 10.06% (25 this November)
- Rasmus Dahlin: 7.58%
- Samuel Girard: 7.12%
- Vince Dunn: 7.05%
Bottom 10 RelGF% (all ages)
- Rasmus Ristolainen: -10.22%
- Oscar Klefbom: -9.03%
- ME Vlasic: -8.22%
- PK Subban: -7.57%
- Erik Johnson: -7.50%
- Nick Leddy: -6.72%
- Jeff Petry: -6.71%
- Neal Pionk: -6.63%
- Drew Doughty: -6.22%
- Seth Jones: -6.10%
__________________________________
Top 10 RelPPGF/60 (vets)
- John Carlson: +5.84
- Mark Giordano: +5.20
- Alex Edler: +3.70
- Victor Hedman: +3.65
- Dustin Byfuglien: +3.39
- Morgan Rielly: +3.18
- Matt Dumba: +3.04
- Cam Fowler: +2.99
- Justin Faulk: +2.95
- Erik Gustafsson: +2.86
Top 5 RelPPGF/60 (U25)
- Neal Pionk: +4.73
- Jakob Chychrun: +4.00
- Darnell Nurse: +1.87
- Rasmus Ristolainen: +1.51 (25 this October)
- Zach Werenski: +1.28
Bottom 5 RelPPGF/60 (all)
- Charlie McAvoy: -7.99
- Mikhail Sergachev: -6.00
- Brandon Montour: -5.16
- Duncan Keith: -4.15
- Noah Hanifin: -4.01
__________________________________
Top 5 RelSHGA/60 (vets) -
- Colton Parayko: -4.30
- Morgan Rielly: -3.27
- Jake Muzzin: -3.16
- Cam Fowler: -2.62
- Brady Skjei: -2.41
- Brent Burns: -1.88
- Shea Weber: -1.87
- Dustin Byfuglien -1.68
- Ryan McDonagh: -1.60
Top 5 RelSHGA/60 (U25)
- Charlie McAvoy: -7.22
- Brett Pesce: -2.14
- Miro Heiskanen: -1.80
- Ivan Provorov: -0.33
- Darnell Nurse: -0.20
Bottom 5 RelSHGA/60 (all)
- Drew Doughty: +3.97
- Ryan Suter: +3.82
- Alex Pietrangelo: +3.48
- Zach Werenski: +3.4
- Neal Pionk: +2.6
Interestingly, but unsurprisingly, most of the top statistical penalty killers are not these top defensemen, but relatively no-name stay-at-home defenders. The top of the powerplay list, conversely, is dominated by the big names. The living anomaly Charlie McAvoy notwithstanding, one thing that stands out, and aligns with common sense, is that veterans seem to be generally much better penalty killers than young defensemen. I noticed a few players like Chabot and Barrie who had very strong PK numbers, but played under the 50 min limit.
And finally, some players who rank well in all three stats: Mark Giordano, John Carlson, Morgan Rielly, Dustin Byfuglien, Shea Weber, Nate Schmidt, Cam Fowler, Justin Faulk, Darnell Nurse.
MatchesMalone
Formerly Innocent Bystander
- Aug 29, 2010
- 1,612
- 1,071
Now applying these stats to the Sens. I'm gonna skip career minor leaguers who may or may not get into some games for us this year.
RelGF% (5on5)
Anthony Duclair (as a Sen) : +23.16
Filip Chlapik : +17.95
Christian Wolanin : +15.09
Thomas Chabot : +10.52
Dylan DeMelo : +10.35
Brady Tkachuk : +6.70
Ron Hainsey : +2.54
Colin White : +2.00
Drake Batherson : +1.14
Connor Brown : +0.06
Artem Anisimov : 0.00
Mikkel Boedker : -3.60
Chris Tierney : -3.81
Alex Formenton : -4.92
Bobby Ryan : -5.37
Christian Jaros : -6.37
JG Pageau : -7.26
Nikita Zaitsev : -8.71
Tyler Ennis : -9.47
Mark Borowiecki : -10.35
Maxime Lajoie : -10.65
Rudolfs Balcers : -12.22
Nick Paul : -15.62
Max Veronneau : -21.11
Logan Brown : -25.00
Vitali Abramov : -33.33
Erik Brannstrom : -40.00
RelPPGF/60 (5on4) (only players with 50+ PP mins last year, or prospects who may see regular time this year)
Max Veronneau : +8.27 (1:11 per game)
Christian Jaros : +6.61 (0:17 per game)
Rudolfs Balcers : +4.66 (1:26 per game)
Drake Batherson : +1.66
Chris Tierney : +0.87
Christian Wolanin : +0.87
Bobby Ryan : +0.48
Maxime Lajoie : -0.76
Colin White : -1.20
Thomas Chabot : -1.28
Connor Brown : -1.47
Brady Tkachuk : -1.55
Dylan DeMelo : -2.09 (0:27 per game)
Anthony Duclair (as a Sen) : -2.94
JG Pageau : -3.41
Artem Anisimov : -4.15
Tyler Ennis : -5.33
Very strange that Chabot was a negative influence to the PP, but I suppose that has to do with the QOC, while Jaros and Wolanin were taking advantage of easier matchups. He also played the most total time on ice and double shifted a lot, so he was playing at times with Duchene and Stone, but also at other times with the second unit, and that time on the second unit would hurt his numbers.
Hate on Bobby Ryan all you want, he's still pretty decent on the powerplay. Interesting potential in Veronneau and Balcers - they'll likely see some time in place of Pageau and Anisimov here and there.
Duclair was actually a fairly positive influence to the PP with Colimbus. Anisimov's numbers weren't very good last year as he was relegated to a non-Kane unit, but he played mostly with Kane the year before and his numbers were much better.
RelSHGA/60 (4on5) (only players with 50+ SH mins last year, or prospects who may see regular time this year) (reminder: the more negative the better)
Andreas Englund : -20.63 (3 games, 2:34 total)
Thomas Chabot : -2.33 (35 seconds per game)
Dylan DeMelo : -2.26
Connor Brown : -0.99
JG Pageau : -0.98
Artem Anisimov : -0.17
Maxime Lajoie : +0.04
Chris Tierney : +0.16
Mark Borowiecki : +1.11
Rudolfs Balcers : +2.56 (0:14 per game)
Nikita Zaitsev : +2.79
Ron Hainsey : +3.79
Colin White : +4.12 (0:13 per game)
Formenton : +5.73 (0:24 per game)
Christian Jaros : +7.58
Turns out Harpur, Ceci and Borowiecki were responsible for a large portion of the powerplay goals against last year. But at least Ceci and Harpur faced the toughest SH QOC on the team. Boro faced the easiest competition and still struggled. Obviously Chabot needs to play more on the PK. Not a strong showing by Colin White in 13 seconds per game, but as I mentioned it's very rare to see young players who are good on the PK; hopefully they'll continue to break him in slowly.
That's a pretty solid top four forwards on the PK in Tierney, Pageau, Brown and Anisimov. But the depth beyond those four is non-existent and the defense and goaltending will likely ensure a bottom five finish in PK%.
Last edited:
Sens of Anarchy
Registered User
- Jul 9, 2013
- 65,533
- 50,259
Not quite the same effort as innocent bystander but ... here goes
https://www.tsn.ca/carriers-and-the-carried-unduly-affecting-their-teams-1.1357943
https://www.tsn.ca/carriers-and-the-carried-unduly-affecting-their-teams-1.1357943
DrEasy
Out rumptackling
And surprise surprise, look who's at the top of their rankings: Mark Stone.Not quite the same effort as innocent bystander but ... here goes
https://www.tsn.ca/carriers-and-the-carried-unduly-affecting-their-teams-1.1357943
MatchesMalone
Formerly Innocent Bystander
- Aug 29, 2010
- 1,612
- 1,071
And surprise surprise, look who's at the top of their rankings: Mark Stone.
RelCF/60: 8th
RelCF%: 3rd
RelSCF/60: 2nd
RelSCF%: 1st
RelHDCF/60: 7th
RelHDCF%: 4th
What a special player.
Sens of Anarchy
Registered User
- Jul 9, 2013
- 65,533
- 50,259
I like these zone exit graphs. This is one measurable area Ottawa has to improve in. Insisting on playing D who are far more comfortable going off the glass and out vs making a play to get it out is part of the problem.
DrEasy
Out rumptackling
I like these zone exit graphs. This is one measurable area Ottawa has to improve in. Insisting on playing D who are far more comfortable going off the glass and out vs making a play to get it out is part of the problem.
Well, based on that graph, Toronto had the same approach as the Sens last year, so unfortunately since we now have their former D coach and some of their defensemen I don't see things changing too much. Things will hopefully change once Brannstrom, JBD and Lassi are added to Chabot and Wideman (if he's still with us by then).
MatchesMalone
Formerly Innocent Bystander
- Aug 29, 2010
- 1,612
- 1,071
ijif
Registered User
- Dec 20, 2018
- 752
- 734
I want to preface this by saying I am far from an analytics expert. I've never studied math or stats beyond the high school level, but I've been a fan of hockey stats since I was a kid, and have continued to keep a very rudimentary following of the advances in analytics over the years.
Earlier this year, in the process of trying to rank the best defensemen in the league, I decided I needed a lot more numbers to go off. I'm of the belief that corsi isn't nearly as useful for evaluating defensemen as it is for forwards. Corsi also only measures 5on5 stats, while special teams are such an important, and specific, part of the game.
So I went searching for some good stats for evaluating defensemen, and found three that I've ended up using a lot lately.
RelPPGF/60 – This stat measures how many more or less goals a team scores on the powerplay when a given player is on the ice than when he's not, per 60 minutes of powerplay time. I set it only for 5-4 PP, to keep things consistent.
When devising a new stat (I’m certain I’m not the first person to invent it, but I haven’t seen it in common use, and it wasn’t a stat that some site had ready-made, I just had the idea and put together some filters), you always want to check and make sure it passes the common sense test, and indeed, the top guys (minimum 50 PP mins) are basically the guys you’d expect to help a powerplay – Draisaitl, Marchand, Point, McDavid, Pastrnak are the top five. As a funny aside, I remember one article on advanced stats years ago talked about the “Pavel Datsyuk test”, as in if Pavel Datsyuk doesn’t rank well in it then you know it’s not a good stat.
The first surprise comes with Alex Chiasson at number ten, but this can largely be explained by him mostly playing with McDavid and Draisaitl on the PP; clearly McDavid and Draisaitl themselves are so high because the rest of the powerplay without them is utter garbage. So yeah, it is partly team dependent in a variety of ways, but overall I’m pretty happy with this stat.
On the other end of the spectrum, there are some surprises. Common sense test is satisfied to see guys like Lars Eller, Sven Andrighetto, Mikael Backlund and Dmitry Orlov in the bottom ten. But I wasn't expecting Charlie McAvoy, Kevin Shattenkirk and Tyler Johnson, although we can imagine some reasons they might be there.
RelSHGA/60 – Same idea as above. This stat measures how many more or less goals a team give up on the penalty kill when a given player is on the ice, per 60 minutes of PK time, specific to 4-5 PK.
This one is a little fuzzier on the common sense test. Penalty killing is a very specific skill that we don’t really have any mainstream stats to quantify besides plain SHTOI, and as much as I glorify TOI, of course coaches can get it wrong sometimes. Iterestingly, the teams who got this wrong and kept playing guys who struggle on the PK were almost universally non-playoff teams.
I would like to hope that this could become the first mainstream stat for evaluating individual performance on the penalty kill.
First looking at some of the worst ranked players (min 50 mins SH): Brian Gibbon ranked the worst; a career AHLer got stuck killing penalties on an awful team because most of the forwards were under 23 after the deadline. Darren Helm and Trocheck ranked 2nd and 9th worst. Maybe the coaches can be excused somewhat here because both guys are there for faceoff abilities and maybe to try to back off opponents with their speed or skill. Kesler ranked 3rd worst, he is there for faceoffs but is old and broken and the coach refused to make a change.
As for the top players in this stat, Charlie McAvoy redeems himself for his powerplay woes, ranking first in the league here. Next we have Ryan Johansen, Erik Cernak, Leo Komarov, Brandon Sutter, Valteri Filppula and Evander Kane. Again, penalty killing is a very specific skill, and until now we haven’t really had any stats to assess individual PK performance, so it is hard to know what to expect, but that all sounds reasonable to me.
Note that this stat is goals against, so a more negative number is better, meaning the player allowed less goals against compared to team average.
RelGF% - This stat measures what percent more or less of the goals a team scores at 5 on 5 when a given player is on the ice. So basically it is adjusted +/-. If a team, on average, scores 48% of the goals at even strength (and their opponents score 52%) and when a given player is on the ice, the team scores 50% of the goals, then that player is +2%. While this is a hell of a lot more useful than +/-, it still isn’t the greatest. Generally speaking, corsi is much more valuable, as luck plays more of a role in being on the ice for a goal scored for or against, as well as the quality of teammates and opponents; whereas an individual player can have more of an effect on driving possession. But as I said, I dont love corsi for valuing defenseman, and adjusted +/- can tell you a lot.
How does RelGF% do on the common sense test? Radulov ranks 1st, Tyler Seguin 4th, and Jamie Benn 14thin the league. When you have such a top-heavy team that relies so much on one elite line, and the rest of the team struggled through injuries and lack of depth, that top line is going to have to come through, and I think the fact that this team managed to make the playoffs is evidence enough that they did indeed come through. Also Teravainen and Aho are 5th and 12th - again, a hard-working, well-structured team that relies heavily on a couple of high-end skilled players. Demers and Copp ranked 2nd and 3rd, and I’m not entirely sure what to make of that. Call them underrated?
This is my least favorite of these stats I’m considering here, but I think it does have some value. Sidney Crosby ranks 7th, so that’s always a good sign.
Then if we look at the bottom ranking players (min 500 mins), everything looks in order. Dubinsky and Riley Nash rank 1st and 4th worst. The other side of the spectrum from Dallas - when you have such a stacked team as Columbus, and you have a couple players having some struggles, of course they’re going to rank poorly here, and Torts rightly played them on the 4th line, 12 and 10 mins a game respectively. Chandler Stephenson ranked 2nd worst, again a mediocre player on a top team. Jack Johnson ranked 11th worst, and any stat that makes Jack Johnson look bad gets bonus points in my book.
One issue with goal-based stats is they require pretty substantial samples to be very useful, or else Lady Luck will rear her ugly head. Corsi, on the other extreme, provides large samples, but I don't find terribly useful for special teams - simply taking shots (without accounting for quality of shot selection) on the PP can lead to loss of possession and/or zone.
So for supplemental stats I've been using relative PP scoring chances for and high danger chances for (RelPPSCF/60 and RelPPHDCF/60) for the powerplay, and relative SH scoring chances against and high danger chances against (RelSHSCA/60 and RelSHHDCA/60) for penalty killing.
A goal-based analysis is very problematic when used for special teams. You will never have a stable, representative sample in a predictive time frame.
I saw you ask a question with your last post, so I will answer. AZ3 player comparison is your best bet for micro stats.
Last edited:
Sens of Anarchy
Registered User
- Jul 9, 2013
- 65,533
- 50,259
Well, based on that graph, Toronto had the same approach as the Sens last year, so unfortunately since we now have their former D coach and some of their defensemen I don't see things changing too much. Things will hopefully change once Brannstrom, JBD and Lassi are added to Chabot and Wideman (if he's still with us by then).
Toronto's retrieval of those dump outs was much more successful. Almost like they were part of a plan vs desperation.
Ad
Latest posts
-
 Barkov finally became a playoffs performer, leader for the Panthers
- Latest: spintheblackcircle
-
