I am curious about this chart. I wish you would explain your statistics. Chiarot's are particularly polarizing, in this chart. I would be curious how Chiarot and Buff compare with Enstrom and Buff in both Corsi and actual results. Because it seems while Enstrom was efficient in Corsi, with passes that led to zone entries, and shots, Enstrom could not defend the front of his net like Chiarot, which made his advanced stats shinier than the results.
As you know I never accept Corsi as dogma unless there is substance to the argument. Chiarot's numbers certainly took a hit playing with Niku, who didn't particularly defend well at all, and who didn't make the chart?
I still think we need another defenseman. To bolster LH depth, but Kulikov to me had been lights out, just smart in every decision he makes. There was one sequence last night where he did everything right in his zone, then makes a beauty backhand feed to Lemieux to exit the zone, who turned it over.
There are lots of these things explained on the internet. If you simply search Google you will find most of these things, including explanations of the statistics, how much value to take from each, and how you use them.
To answer your questions:
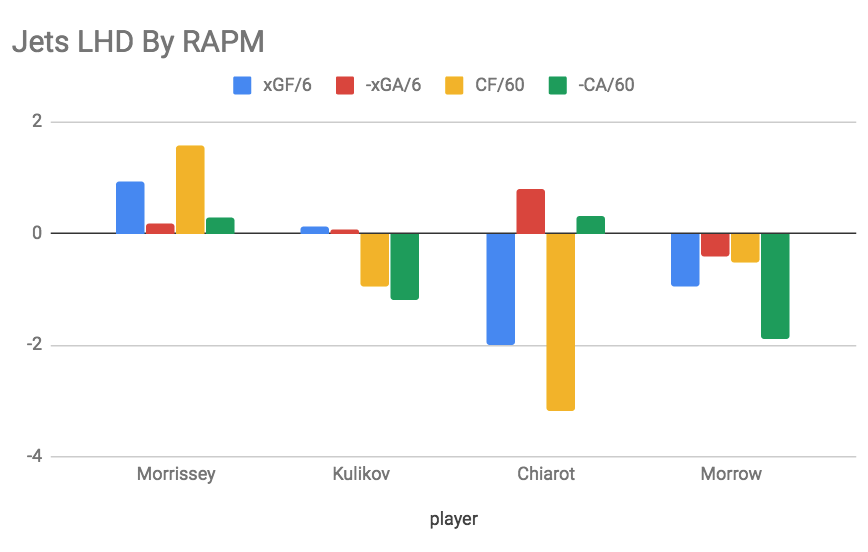
The above bars are both Corsi and Expected Goals for and against using a regression model to account for a player’s linemates, player’s linematching, and other usage factors like score deployment and zone deployment (which means that time with Niku only hurts him if Niku was shown as good by the metric and he made Niku worse).
What the numbers suggest is that Chiarot prevents shots against (Corsi) at a *slightly* above league average rate after accounting for all those usage factors above. The expected goal model states the same when including his impact on shot quality. It should be noted that xGoals are less predictive than Corsi.
Regardless of “substance of the argument,” Corsi predicts future results better than goals or expected goals... IE: when advance stats are shinier than “results” (except advance stats are results... just that shots are proven to be more predictive of future success in goals than past success in goals), it usually just means the results will move towards advance stats in time.
The issue is that the trade off for improved defense with Chiarot is not worth the amount Chiarot hurts offense. Chiarot improves defense by a smaller value than he hurts offense. When you add the two together he’s ranked worse than what you’ld hope a bottom pair defender would be.
Ironic that you point out Enstrom, as Enstrom, like Chiarot, helped defense but hurt offense. Unlike Chiarot though, Enstrom was a positive tradeoff as his help on defense was much greater than the degree he hurt offense.
Enstrom was actually one of the NHL’s best defenders in preventing shots infront of the net. The issue is the eye test is terrible at measuring defensive impact as the eye test actually doesn’t see most of defense. Offense is adding events, so you can see what a player does. Defense is mostly the absence of events. You can see how Chiarot and Enstrom look when the puck ends up in front of the net and they need to clear but you cannot “see” the times they don’t have to be there. By thinking defense as the moments you see someone defend, you are actually ignore a big chunk of defense.
It’s also ironic that you defend Chiarot. Goals, or results as you call them, actually paint Chiarot as WORSE than Corsi or Expected Goals. Advance stats suggest Chiarot’s linemates should have their goal differential worsen by 0.1 goals per hour playing with him but have actually been 0.15 per hour worse.
So why don’t you argue against Chiarot more than I do?