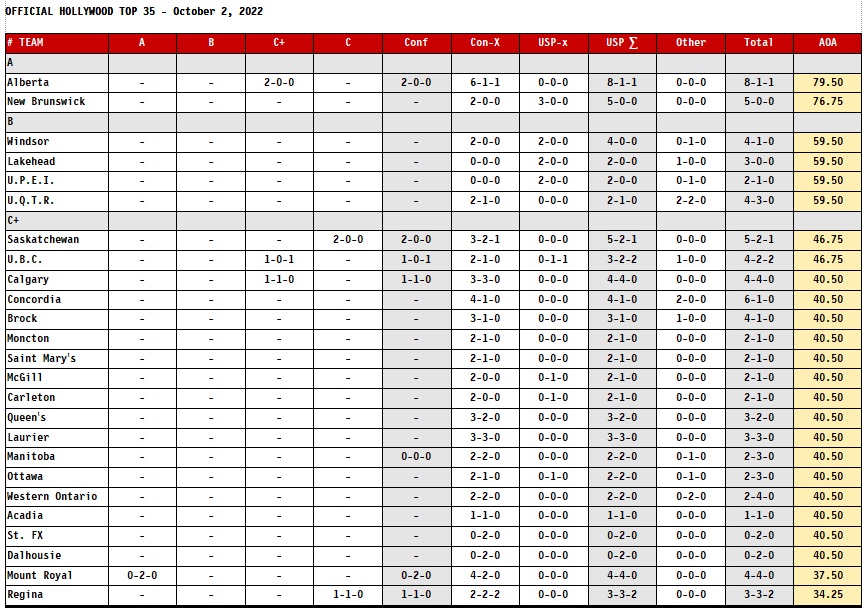
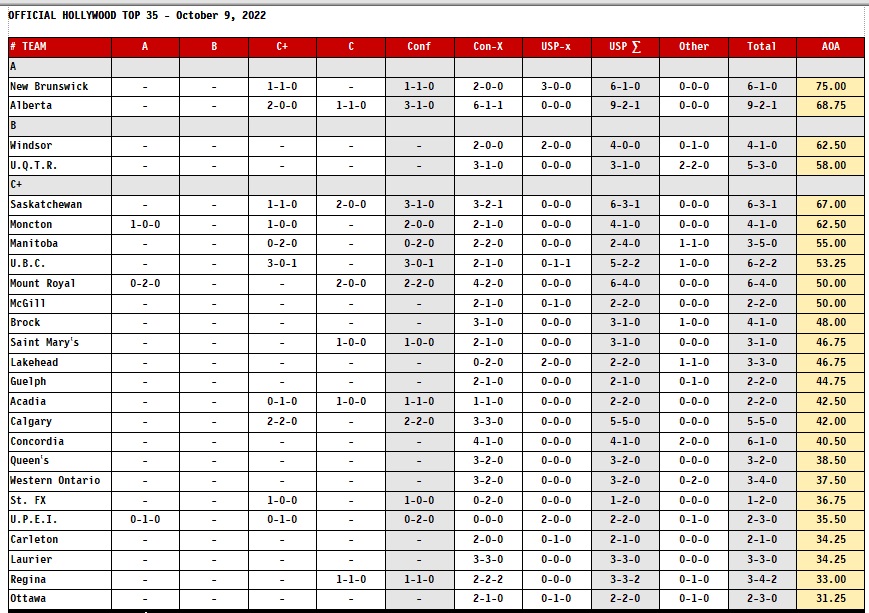
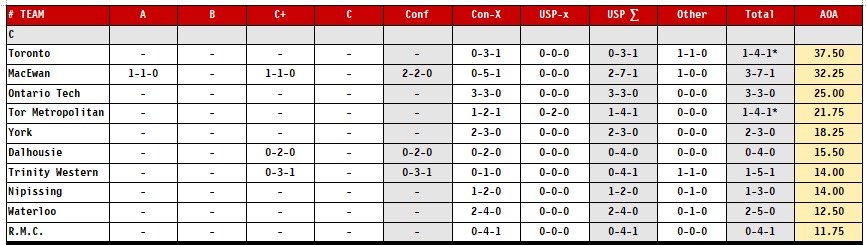
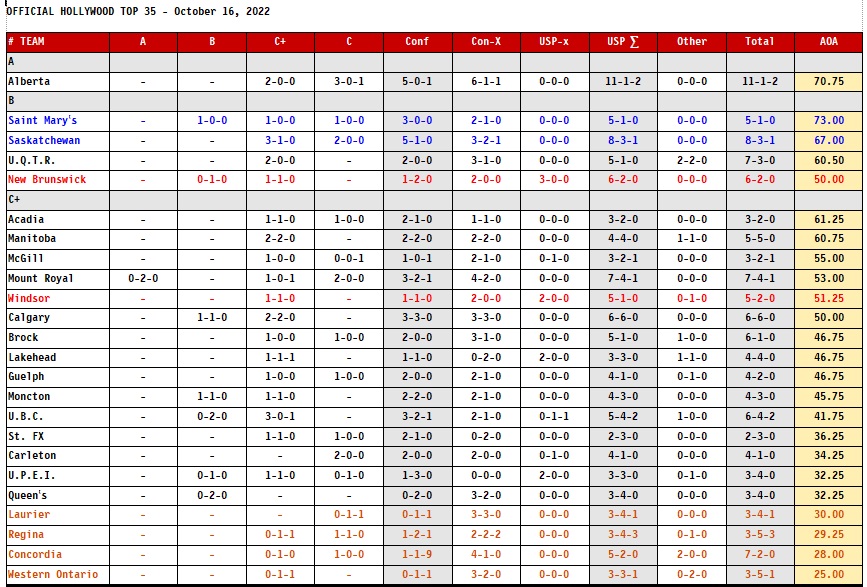
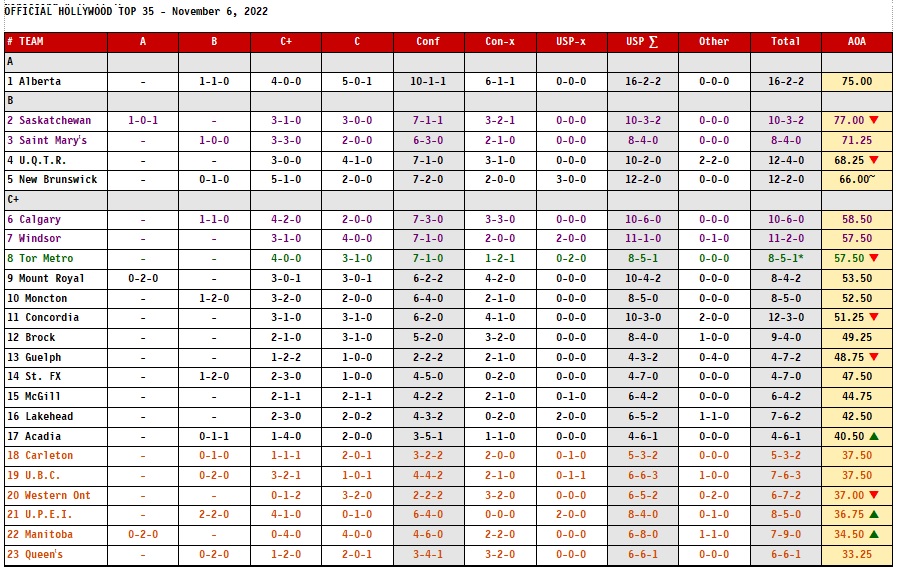
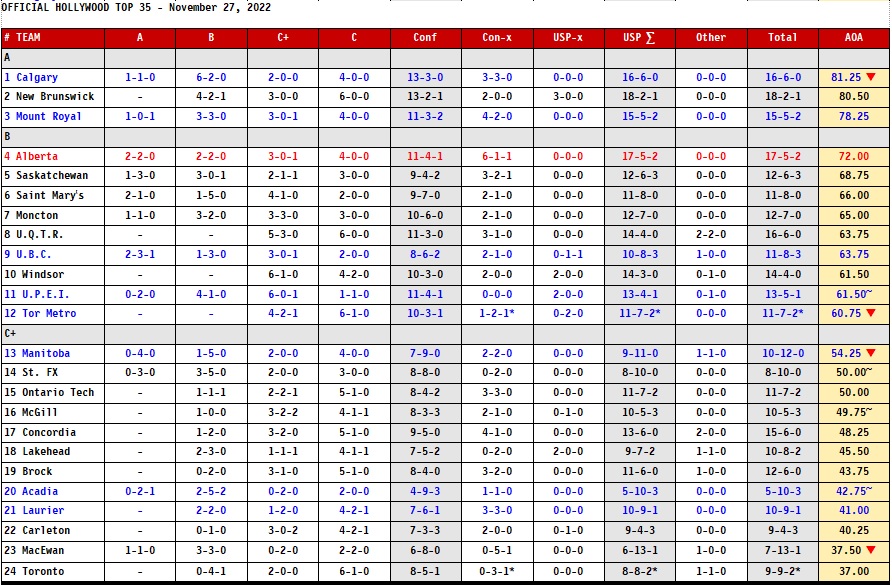
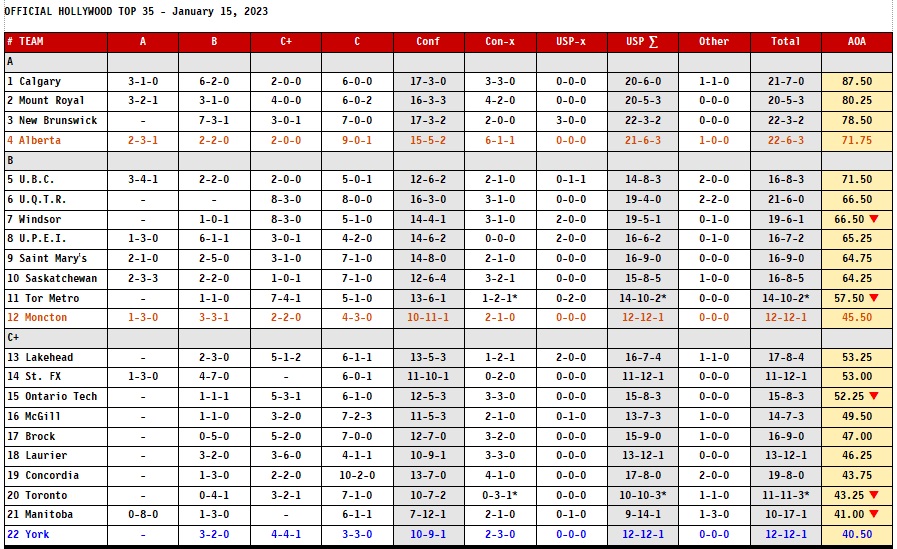
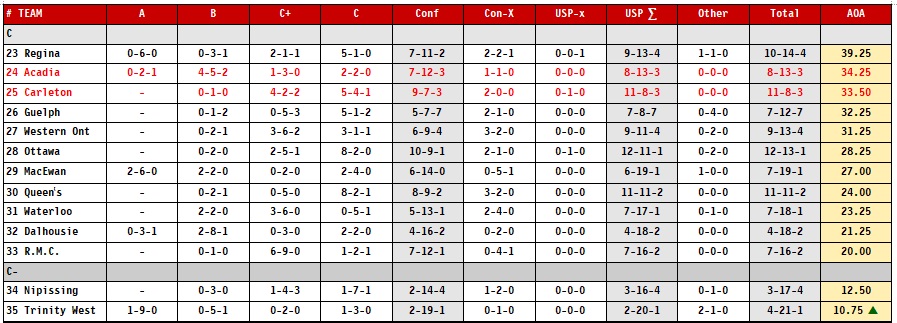
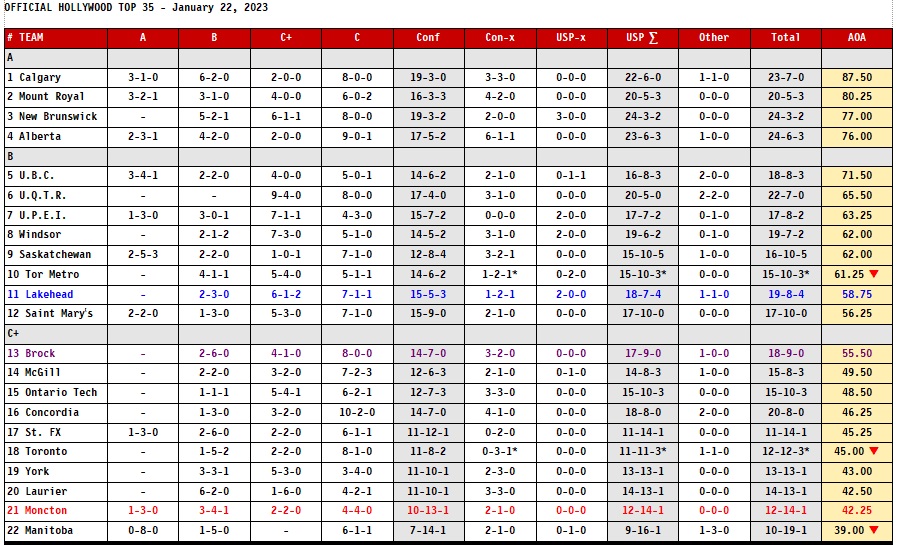
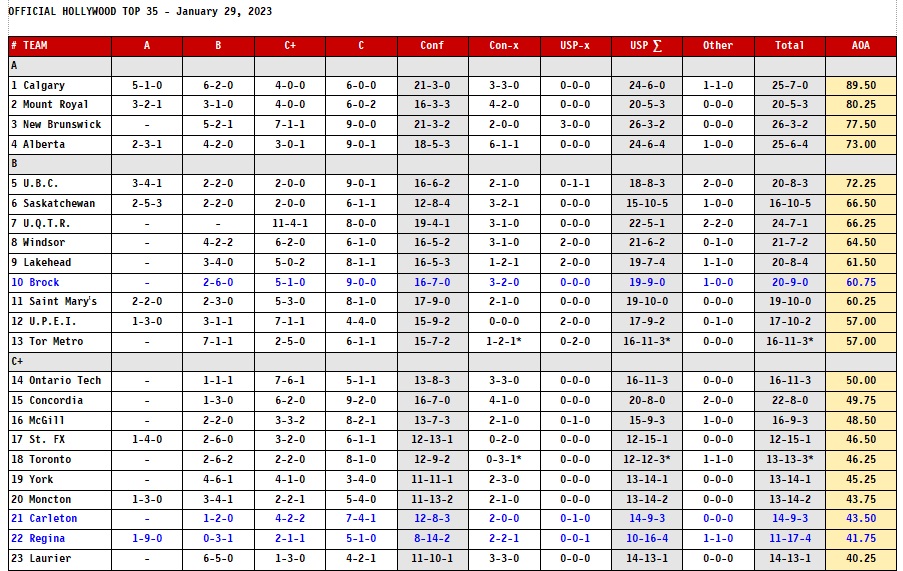
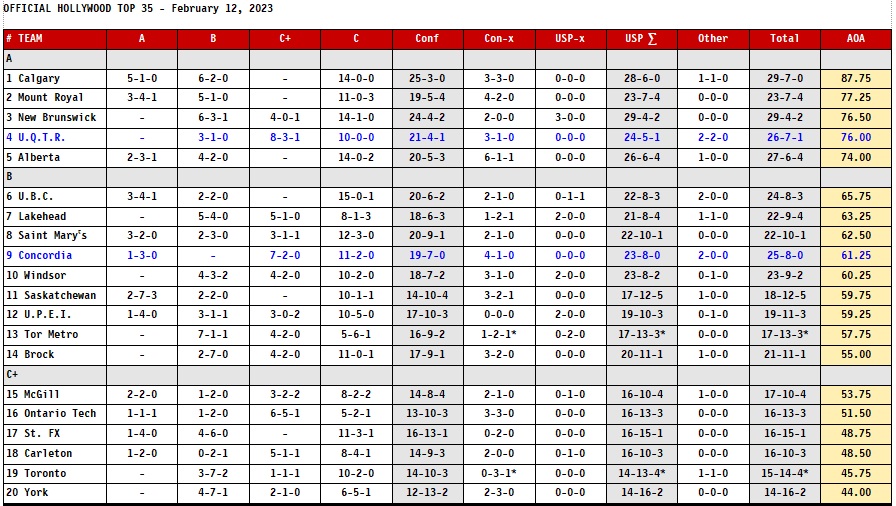
OFFICIAL HOLLYWOOD TOP 35 ~ 2022-23 ~ POLL 8
The AOA is calculated the same as last week. Fewer teams have a plus or minus which would be impacted by inclusion of non-conference games.
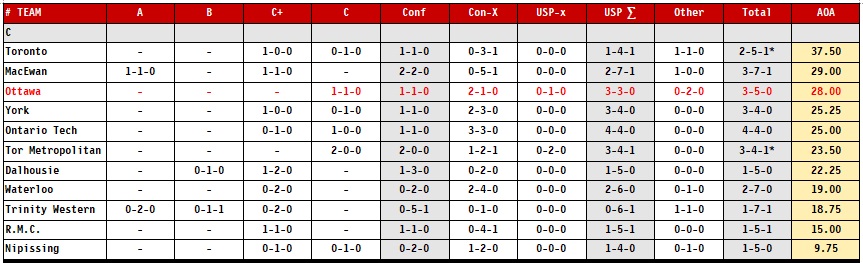
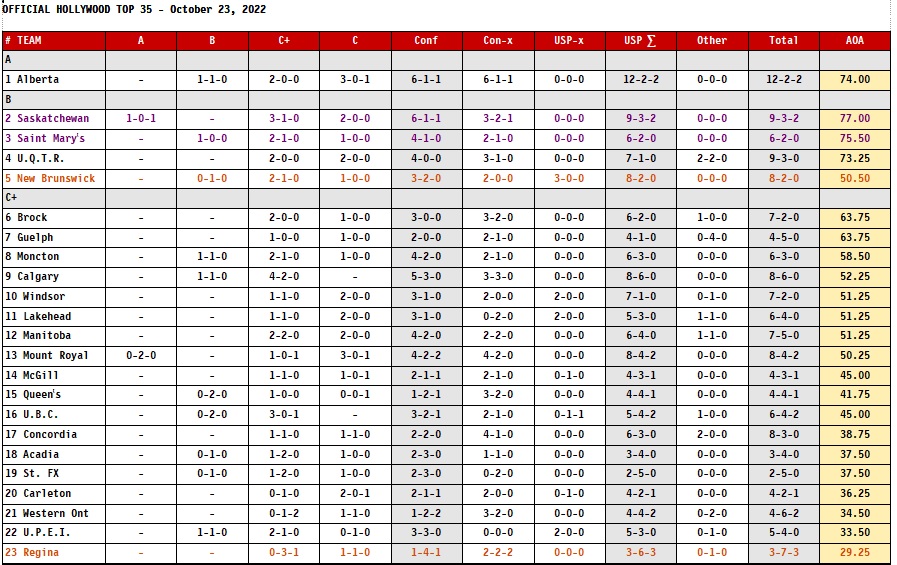
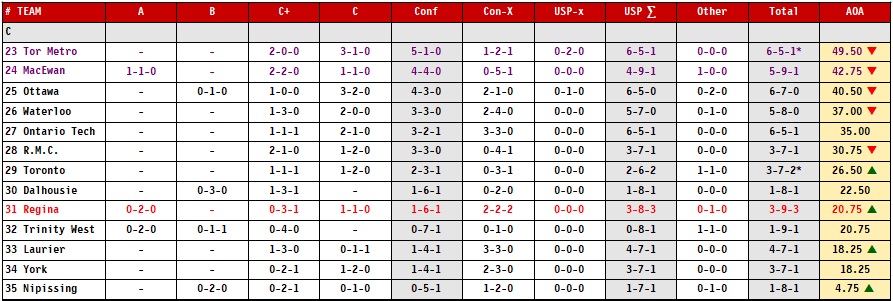
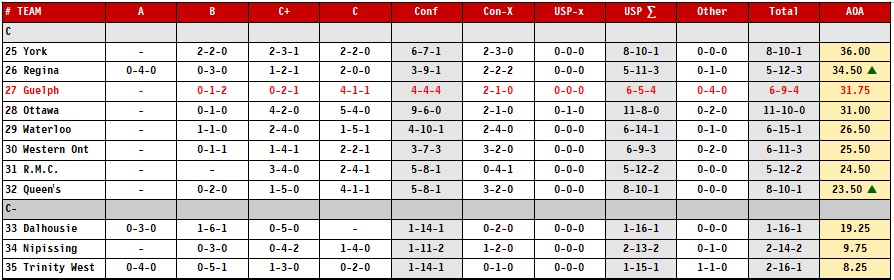
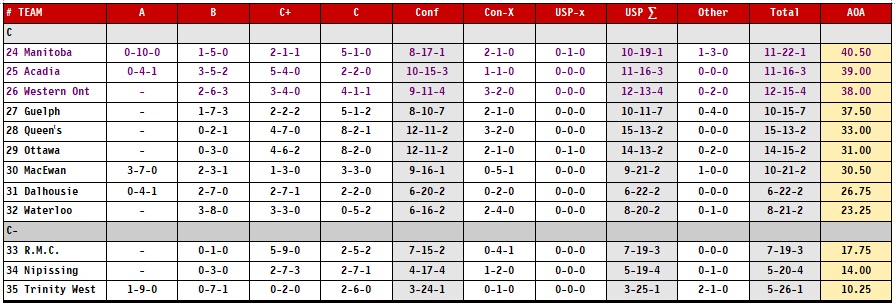
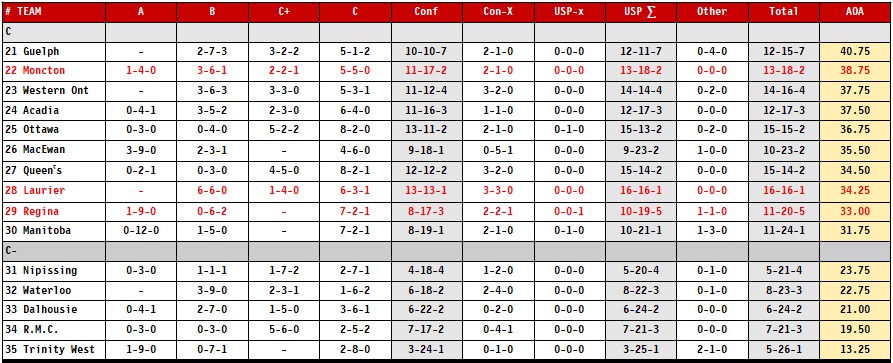
Toronto Metropolitan moved up from C to C+ (marked in green) and no teams moved down.
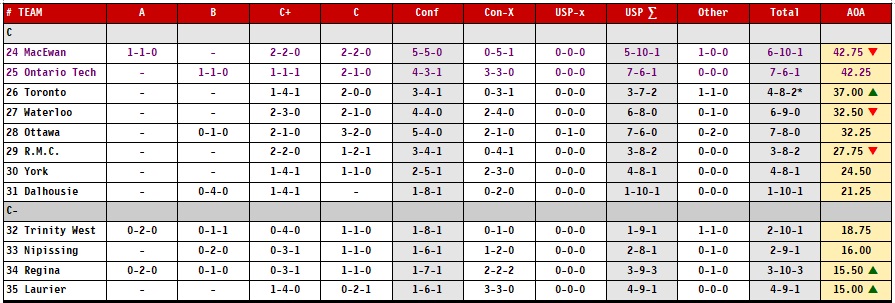
A lot of C+ teams are in danger of demotion (colured in orange): Carleton, UBC, UWO, UPEI, Manitoba, and Queen‛s.
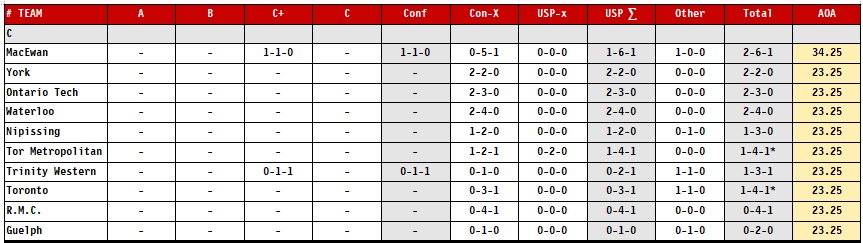
Saskatchewan and Saint Mary‛s remain as promotion candidates from B to A and MacEwan and Ontario Tech are likewise from C to C+. All those are coloured in purple.
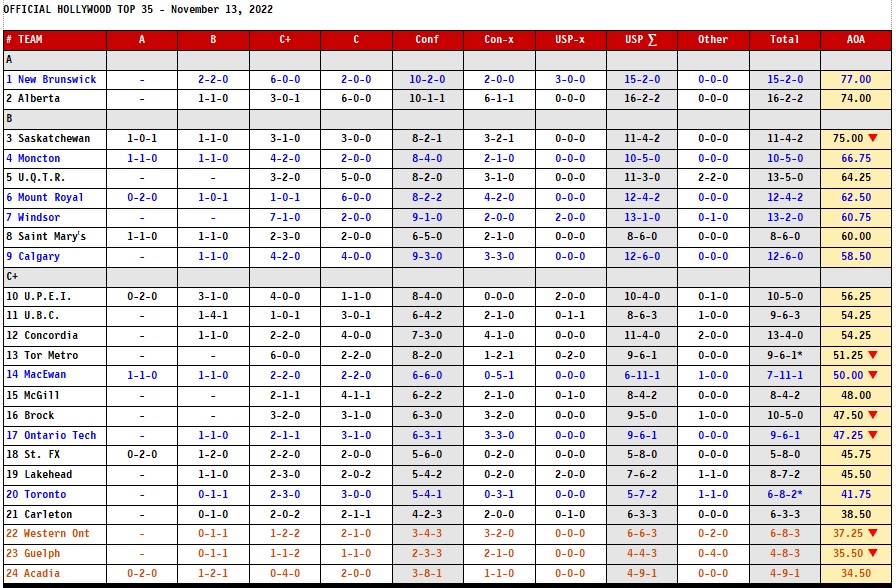
New Brunswick is the first team with a “smoothed” result, due to the one loss vs. B teams.
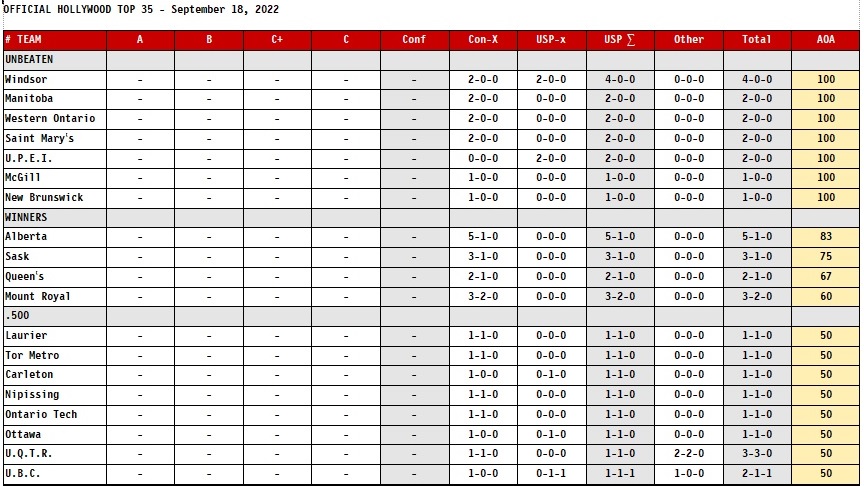
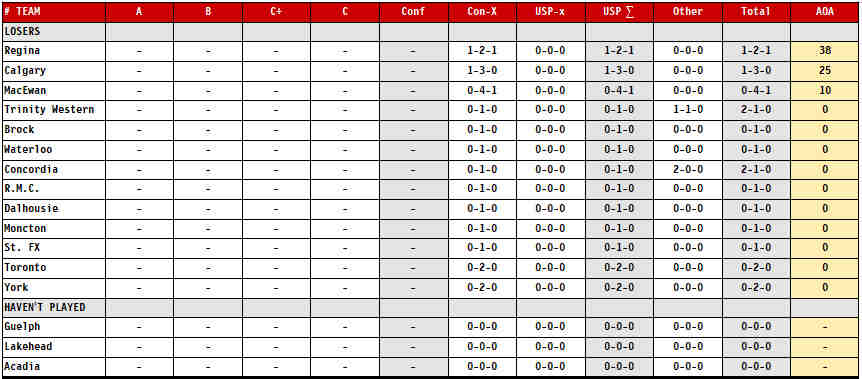
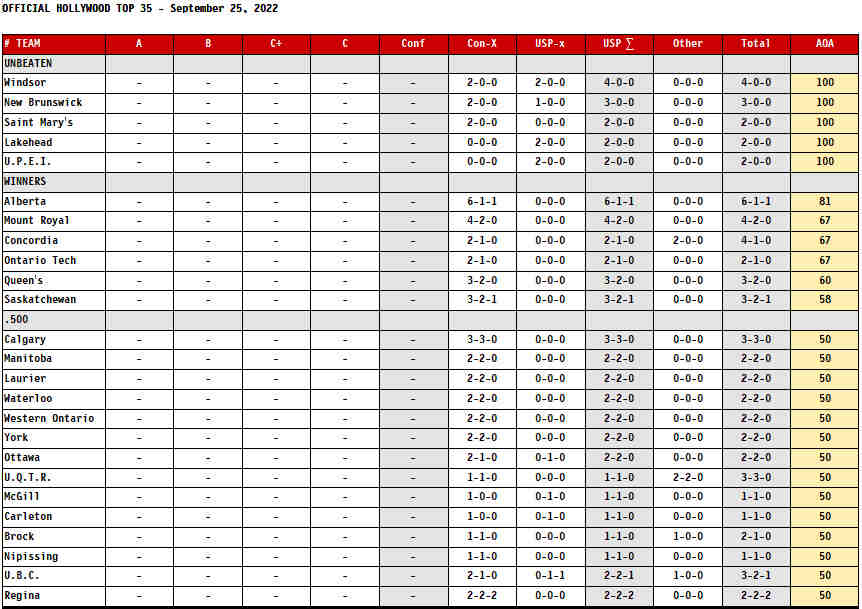
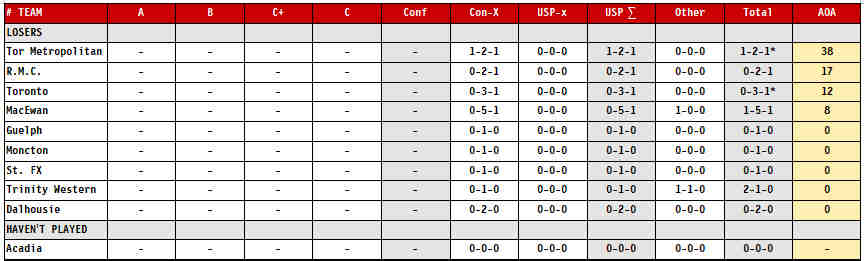
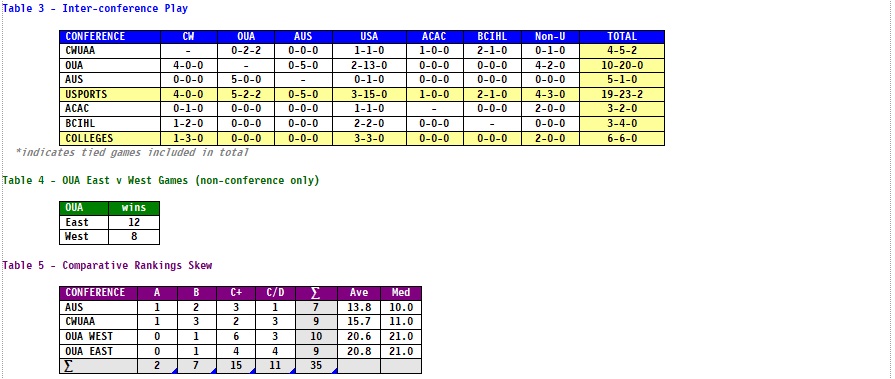
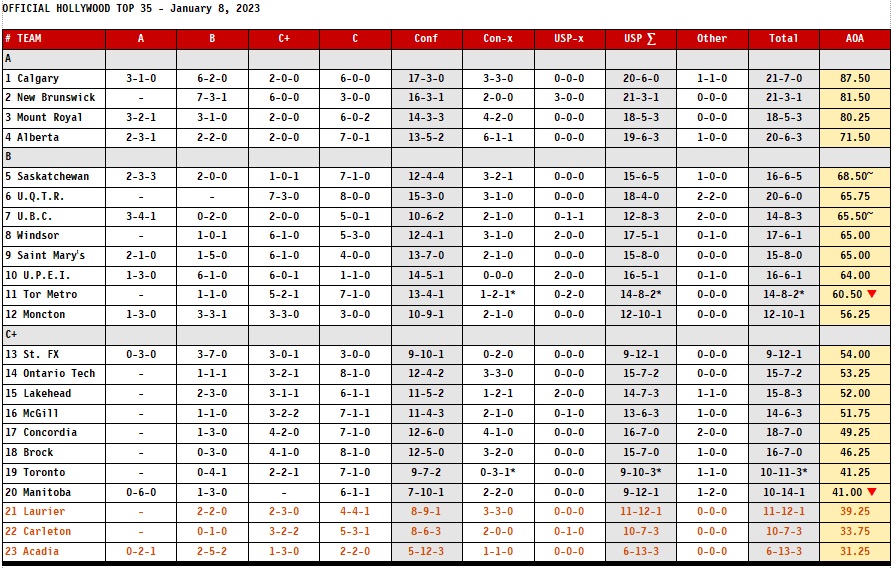
* indicates total includes a tie game
Conf. indicates overall conference record
Conf-x indicates exhibition record within conference
USP-x indicates exhibition record within USports but outside conference
USP ∑ indicates regular season and exhibition record against USports teams
Other indicates record against non-USports teams
Total indicates record against all teams
AOA is the average of averages against each category of opponent.
~ Indicates results "smoothed" to reduce impact of categories with fewer games. The categories are merged and the value applied to both.
I calculated the AOA for teams which would have a swing of 5 points or more if non-conference games were included. Those numbers are:
Teams that would drop:
▼
Saskatchewan 77.00 71.00
UQTR 68.25 61.50
Brock 55.50 48.75
Concordia 51.25 42.75
Tor Metro 57.50 39.75
Guelph 48.75 37.50
MacEwan 42.75 31.25
Ottawa 40.50 31.00
Western Ontario 37.00 25.50
Waterloo 32.50 23.75
RMC 27.75 21.75
Teams that would rise:
▲
UPEI 36.75 49.75
Toronto 37.00 47.25
Manitoba 34.50 46.50
Acadia 40.50 46.00
Regina 15.50 25.75
Laurier 15.00 22.50
Nipissing 4.75 11.75
Links:
➤ USports: Presto Schedule & Results
➤ CWUAA: Hockey Tech Schedule & Results : LeagueStat
➤ OUA: LeagueStat Daily
➤ AUS: Schedule & Results