Wins Above Replacement 2.0

NHL WAR

Registered User
Sep 29, 2018
959
1,176
Hey guys. Many of you may have seen my original Wins Above Replacement post last fall. After taking a short break, I decided to make adjustments. I have just focused on forwards since, but I do intend to reintroduce defensemen and goaltender models in the future. Notable changes include the integration of expected goals and an increased importance on even-strength play compared to special teams. I ran the results dating back to the 2015-16 season. I feel that they are insightful, but at the same time honest to what happens on the ice. Nothing sticks out like a sore thumb. Here are the top 5 performers for each season of data:

2015-16

PlayerWAR
Patrick Kane7.2
Sidney Crosby5.7
Anze Kopitar5.6
Jamie Benn5.6
Evgeny Kuznetsov5.4
[TBODY] [/TBODY]


2016-17

PlayerWAR
Connor McDavid7.7
Sidney Crosby6.3
Brad Marchand6
Nikita Kucherov5.8
David Pastrnak5.2
[TBODY] [/TBODY]


2017-18

PlayerWAR
Connor McDavid7.6
Claude Giroux6.9
Nikita Kucherov6.7
Taylor Hall6.1
Nathan MacKinnon5.9
[TBODY] [/TBODY]

2018-19

PlayerWAR
Nikita Kucherov8.4
Sidney Crosby7.5
Connor McDavid7.4
Johnny Gaudreau6.9
Steven Stamkos6.4
[TBODY] [/TBODY]


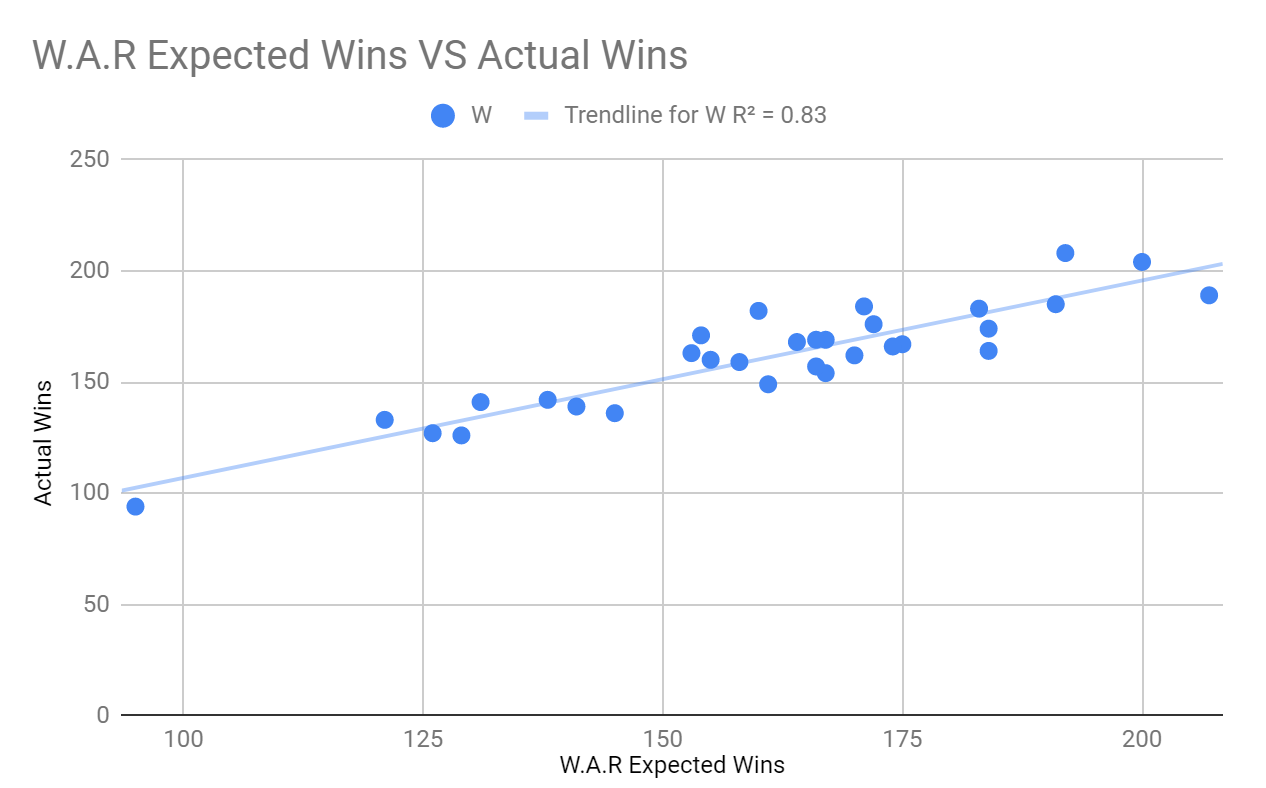
WAR also works on a team level. The total WAR of a team's forwards plus the estimated number of games a team full of replacement level players would win lines up very well with the number of games a team actually wins. To be more clear:

XVDXY4QcTm4FhK6f50msasdej7OuMLoGBlU592CE38EpO4eZOMbNC43DJj96Ed8ZuGb6sL7ndbbZwdL_ETNfaJ625p9uYRBJw1ppOUu1S28UTiv4FYoCXOKjgkAqxLZNHMoGPpTX


If you would like to read a more detailed description and more importantly, see more results: A Winning Statistic


I have already started looking at a player's WAR after he signs a new contract or if there is a trade to aid my decision on whether or not it is a good deal. If you would be interested in seeing complete data set, just let me know and I will be happy to oblige.

If you have any other questions or requests, again, feel free to ask.
 

NHL WAR

Registered User
Sep 29, 2018
959
1,176
The WAR expected wins and the actual wins, since the WAR components expectedly are these that produce wins: scoring more goals/points for example.

You are correct. My point in showing the graph was to illustrate the fact all components of this WAR stat do also impact actual wins ( are confounding) and are proportionally weighted by how much they impact them. If the stat had instead been constructed with hits, shorthanded goals and 3 on 3 secondary assists as the biggest factors then there would be little to no correlation. Basically, it was by design that they are confounded as the point of WAR is to reward things a player does that impacts the success of his team. If I had received a low correlation, then it would've been back to the drawing board.
 
  • Like
Reactions: DatsyukToZetterberg

morehockeystats

Unusual hockey stats
Dec 13, 2016
617
296
Columbus
morehockeystats.com
You are correct. My point in showing the graph was to illustrate the fact all components of this WAR stat do also impact actual wins ( are confounding) and are proportionally weighted by how much they impact them. If the stat had instead been constructed with hits, shorthanded goals and 3 on 3 secondary assists as the biggest factors then there would be little to no correlation. Basically, it was by design that they are confounded as the point of WAR is to reward things a player does that impacts the success of his team. If I had received a low correlation, then it would've been back to the drawing board.
I am not sure that the degree of confounding is low enough to make the correlation of 0.83 look high.
 

NHL WAR

Registered User
Sep 29, 2018
959
1,176
I am not sure that the degree of confounding is low enough to make the correlation of 0.83 look high.

I respect that. I also think it would be a huge undertaking to have a WAR construct that takes all the necessary things into account that also has a R2 of say 0.9 or more. I think that this one could be (and likely someday will be) improved upon, but the improvements would be marginal. Getting that 0.95 correlation would require throwing everything out of the window except goals. This would make WAR pointless... why not just look at goals or G/60 instead. It would also be entirely confounded.
 
  • Like
Reactions: Yackiberg8

NHL WAR

Registered User
Sep 29, 2018
959
1,176
Also keep in mind that this is entirely based off of forwards. With the creation and implementation of d-men and goalie WAR, the correlation would undoubtedly rise.
 
  • Like
Reactions: DatsyukToZetterberg

NHL WAR

Registered User
Sep 29, 2018
959
1,176
Cool!

I would love to see this done historically, going back 50 years or whatever...

Yes, historical seasons would have to be more of an estimate due to limitations in data, but it would be very interesting. Definitely something I'll have to take a look at.
 

Midnight Judges

HFBoards Sponsor
Sponsor
Feb 10, 2010
13,623
10,235
Couple things: You list assists as objective, but actually in the NHL there is a degree of subjectivity in assists:

Some NHL Stars Get More Assists At Home Than They Deserve

What are the exact weights of the factors? You give a ranking but no weights. So we know the order but not the proportionality.

What is the statistical basis for these weights? What is the rationale for an even strength secondary assist being more important than a power play primary assist?

What is the rationale for a power play goal being less valuable than an ES primary assist?
 

Midnight Judges

HFBoards Sponsor
Sponsor
Feb 10, 2010
13,623
10,235
Just to look at face-offs, you have Ryan O'Reilly's best season as a +5.4 when he was 60% at face-off effectiveness (10% above average).

But Kuznetsov is a -3 in 2018-2019 when his face-off percentage was a putrid 38.7% (11.3% below average).

How is Kuz's negative less than O'Reilly's is positive when Kuz is farther from the average?

If plus 10% above average = 5.4 goals above replacement, shouldn't 11.3% below average = roughly -6.1?

I guess you're assuming the replacement is like 47% effective or something like that.
 

Midnight Judges

HFBoards Sponsor
Sponsor
Feb 10, 2010
13,623
10,235
Do you have power play goals listed as less than half the value of an ES goal?

I do not know how else Tavares gets more credit for goals in 18-19 than Ovechkin. JT had 4 more ES goals (37 to 33) but Ovie had 8 more powerplay goals.

edit: I am reading that a PP primary assist is worth .61 and a ES goal is worth 1 and a PP goal is worth equal or more than a PP primary assist. So there must be something else going on here. Perhaps empty net goals are the difference. - Ovie had 4 and JT had none.
 
Last edited:

Filthy Dangles

Registered User*
Oct 23, 2014
28,559
40,111
Just to look at face-offs, you have Ryan O'Reilly's best season as a +5.4 when he was 60% at face-off effectiveness (10% above average).

But Kuznetsov is a -3 in 2018-2019 when his face-off percentage was a putrid 38.7% (11.3% below average).

How is Kuz's negative less than O'Reilly's is positive when Kuz is farther from the average?

If plus 10% above average = 5.4 goals above replacement, shouldn't 11.3% below average = roughly -6.1?

I guess you're assuming the replacement is like 47% effective or something like that.

Volume? Kuznetsov has a much worse rate but probably took less total face offs.
 

NHL WAR

Registered User
Sep 29, 2018
959
1,176
What is the statistical basis for these weights? What is the rationale for an even strength secondary assist being more important than a power play primary assist?


What is the rationale for a power play goal being less valuable than an ES primary assist?

The relationship between a stat and goals for (or in the defensive stats case goals against), which in turn represents the stats correlation to wins, determined its weight.

Since the majority of a game is played at even strength, even strength play matters more in the long run with regards to winning.

Just to look at face-offs, you have Ryan O'Reilly's best season as a +5.4 when he was 60% at face-off effectiveness (10% above average).

But Kuznetsov is a -3 in 2018-2019 when his face-off percentage was a putrid 38.7% (11.3% below average).

How is Kuz's negative less than O'Reilly's is positive when Kuz is farther from the average?

If plus 10% above average = 5.4 goals above replacement, shouldn't 11.3% below average = roughly -6.1?

I guess you're assuming the replacement is like 47% effective or something like that.

The amount of faceoffs they took. O'Reilly took more than twice as many faceoffs as Kuznetsov. This more than makes up for Kuznetsov being slightly more had than O Reilly is good at faceoffs.

Also, the players are originally compared to league average (so for faceoffs 50% at even strength, slightly higher on the PP and slightly lower on the PK.) Then, once every players Wins Above Average are calculated, they are further compared to a replacement level player ( identified using factors such as salary and ATOI). I think replacement level is roughly -0.2 Goals Above Average/60.

Do you have power play goals listed as less than half the value of an ES goal?

I do not know how else Tavares gets more credit for goals in 18-19 than Ovechkin. JT had 4 more ES goals (37 to 33) but Ovie had 8 more powerplay goals.

edit: I am reading that a PP primary assist is worth .61 and a ES goal is worth 1 and a PP goal is worth equal or more than a PP primary assist. So there must be something else going on here. Perhaps empty net goals are the difference. - Ovie had 4 and JT had none.

PP goals are valued at 0.7. While they had nearly identical ice time totals at even strength, Ovechkin got 140 more minutes on the power play than Tavares, so his 8 more power play goals aren't as impressive as they look at face value.
 

Midnight Judges

HFBoards Sponsor
Sponsor
Feb 10, 2010
13,623
10,235
Thanks for answering the questions BTW.

The relationship between a stat and goals for (or in the defensive stats case goals against), which in turn represents the stats correlation to wins, determined its weight.

How did you determine what the relationship is between a goal, a primary assist, and a secondary assist?

NHL WAR said:
Since the majority of a game is played at even strength, even strength play matters more in the long run with regards to winning.

Are you sure time on ice is the applicable factor here? Wouldn't percentage of scoring also be a valid way to look at it?

For example, if power play goals account for roughly 20% of all goals scored, but power play minutes only amount to ~ 14% of TOI, you've really just de-emphasized those goals/points by 43% even though they win games the same as any other points.
 

NHL WAR

Registered User
Sep 29, 2018
959
1,176
Thanks for answering the questions BTW.


How did you determine what the relationship is between a goal, a primary assist, and a secondary assist?


Are you sure time on ice is the applicable factor here? Wouldn't percentage of scoring also be a valid way to look at it?

For example, if power play goals account for roughly 20% of all goals scored, but power play minutes only amount to ~ 14% of TOI, you've really just de-emphasized those goals/points by 43% even though they win games the same as any other points.

Linear regression was the main tool for determining the relationships.

And you are right with the ES/ PP goals. I should have said: since the majority of the game is played at even strength, the majority of goals are scored at even strength, making them more important to winning in the long run.
 

Filthy Dangles

Registered User*
Oct 23, 2014
28,559
40,111
Appreciate the sharing of the work.

Any info on how defensive goals saved is computed?

I would assume it does something like Expected Goals For - Expected Goals Against at Even Strength? Is there any adjustment for playing harder minutes/competition? I see your glossary mentions adjusting for zone starts, that would kinda be akin to the Positional Adjustment in baseball where players get a boost for playing tougher positions (like Shortstop or Catcher) I would guess.
 

NHL WAR

Registered User
Sep 29, 2018
959
1,176
Appreciate the sharing of the work.

Any info on how defensive goals saved is computed?

I would assume it does something like Expected Goals For - Expected Goals Against at Even Strength? Is there any adjustment for playing harder minutes/competition? I see your glossary mentions adjusting for zone starts, that would kinda be akin to the Positional Adjustment in baseball where players get a boost for playing tougher positions (like Shortstop or Catcher) I would guess.

Defensive goals saved is made up of expected goals against, corsi against, takeaways and blocked shots. For example, a player's expected corsi against is calculated using their zone starts, their teammates CA/60 and league average CA/60. The difference between their expected corsi against and actual corsi against is their "impact." Same process for xGA. (Only even strength data was used.)

I didn't want to unjustly reward players who had high takeaway and blocked shots totals just because they never had the puck, so an above expectation formula was used there, as well. The average takeaway/ blocked shot per corsi against ratio was calculated and then multiplied by each player's CA. Then the same approach of comparing actual to expected was repeated.

Finally, the expected goals against and corsi against portions were merged together. (I don't remember the exact weighting, but it was close to 50-50.) I felt doing this created a number that showed a player's impact on both limiting shots and limiting shot quality, without double counting. Overall, probably the component of WAR with the most guesswork involved, but there isn't an abundance of great data to work with. The results still feel right to me for the most part though.
 
  • Like
Reactions: Filthy Dangles

Filthy Dangles

Registered User*
Oct 23, 2014
28,559
40,111
Defensive goals saved is made up of expected goals against, corsi against, takeaways and blocked shots. For example, a player's expected corsi against is calculated using their zone starts, their teammates CA/60 and league average CA/60. The difference between their expected corsi against and actual corsi against is their "impact." Same process for xGA. (Only even strength data was used.)

I didn't want to unjustly reward players who had high takeaway and blocked shots totals just because they never had the puck, so an above expectation formula was used there, as well. The average takeaway/ blocked shot per corsi against ratio was calculated and then multiplied by each player's CA. Then the same approach of comparing actual to expected was repeated.

Finally, the expected goals against and corsi against portions were merged together. (I don't remember the exact weighting, but it was close to 50-50.) I felt doing this created a number that showed a player's impact on both limiting shots and limiting shot quality, without double counting. Overall, probably the component of WAR with the most guesswork involved, but there isn't an abundance of great data to work with. The results still feel right to me for the most part though.

Thanks, is there anywhere I can view leaders in this component of your WAR model?

Also, I would imagine that this impact is much greater for defensemen than forwards, did you run this for defensemen as well?
 

NHL WAR

Registered User
Sep 29, 2018
959
1,176
Thanks, is there anywhere I can view leaders in this component of your WAR model?

Also, I would imagine that this impact is much greater for defensemen than forwards, did you run this for defensemen as well?

Here are the top 50 from the years I have ran the data for (2007/08, 2015-19):

PlayerDGSSeason
PAVEL.DATSYUK 6.507/ 08
PAVEL.DATSYUK 5.415/16
MIKKO.KOIVU5.317/18
PATRICE.BERGERON5.316/17
NINO.NIEDERREITER4.916/17
NINO.NIEDERREITER 4.615/16
BARCLAY.GOODROW4.518/19
NICK.SHORE 4.515/16
HENRIK.ZETTERBERG 4.407/ 08
DOMINIK.SIMON4.418/19
DANTON.HEINEN4.317/18
LOUI.ERIKSSON 4.207/ 08
MARCUS.FOLIGNO4.118/19
ADAM.LOWRY4.117/18
JOE.THORNTON407/ 08
JERE.LEHTINEN 407/ 08
TEUVO.TERAVAINEN417/18
ANDREW.COPP417/18
DAVID.KREJCI418/19
NIKOLAY.ZHERDEV 407/ 08
TEUVO.TERAVAINEN3.916/17
DMITRIJ.JASKIN3.917/18
RILEY.NASH3.917/18
JOHAN.FRANZEN 3.907/ 08
MARCUS.JOHANSSON3.916/17
MARCUS.FOLIGNO3.817/18
BRAD.MARCHAND3.816/17
JOE.THORNTON 3.715/16
JAKE.DEBRUSK3.718/19
JOE.THORNTON3.618/19
JESPERI.KOTKANIEMI3.618/19
BRETT.RITCHIE3.617/18
BLAKE.COLEMAN3.517/18
ANTHONY.CIRELLI3.518/19
BRANDON.SAAD3.516/17
DEREK.RYAN3.517/18
RILEY.NASH3.418/19
PATRICE.BERGERON3.415/16
RILEY.NASH3.416/17
DMITRIJ.JASKIN3.415/16
DEREK.RYAN3.418/19
JUSSI.JOKINEN3.415/16
JADEN.SCHWARTZ3.318/19
MATT.STAJAN3.316/17
MIKKO.KOIVU 3.315/16
BLAKE.WHEELER3.316/17
TREVOR.LEWIS3.316/17
VLADISLAV.NAMESTNIKOV3.215/16
MARK.STONE3.216/17
STEFAN.NOESEN3.217/18
[TBODY] [/TBODY]

I haven`t done a revamped model for defensemen, but in my original one (using corsi, takeaways and blocked shots, no expected goals) defenseman had a bigger impact than forwards. In the one season of data I ran, Giordano was first with guys like Slavin, Ekholm, Parayko and Doughty rounding out the top 10.
 
  • Like
Reactions: Filthy Dangles

supsens

Registered User
Oct 6, 2013
6,577
2,000
Defensive goals saved is made up of expected goals against, corsi against, takeaways and blocked shots. For example, a player's expected corsi against is calculated using their zone starts, their teammates CA/60 and league average CA/60. The difference between their expected corsi against and actual corsi against is their "impact." Same process for xGA. (Only even strength data was used.)

I didn't want to unjustly reward players who had high takeaway and blocked shots totals just because they never had the puck, so an above expectation formula was used there, as well. The average takeaway/ blocked shot per corsi against ratio was calculated and then multiplied by each player's CA. Then the same approach of comparing actual to expected was repeated.

Finally, the expected goals against and corsi against portions were merged together. (I don't remember the exact weighting, but it was close to 50-50.) I felt doing this created a number that showed a player's impact on both limiting shots and limiting shot quality, without double counting. Overall, probably the component of WAR with the most guesswork involved, but there isn't an abundance of great data to work with. The results still feel right to me for the most part though.

Are players penalized for giveaways?
And if I score a PP goal in ten strait games how in any way is that less valuable than someone who scored 1 even strength goal in 10 strait games?
I understand it’s harder to score at even strength but the final score of the game could care less how the goal was scored.
 

NHL WAR

Registered User
Sep 29, 2018
959
1,176
Are players penalized for giveaways?
And if I score a PP goal in ten strait games how in any way is that less valuable than someone who scored 1 even strength goal in 10 strait games?
I understand it’s harder to score at even strength but the final score of the game could care less how the goal was scored.

Giveaways are not used. Players with a lot of giveaways tend to be primary puck movers for their teams and therefore valuable. A giveaway per CF ratio may have somewhat pardoned the Drew Doughtys of the world, but overall I didn't think it would be worth the trouble. Especially when you consider the subjectiveness of what is recorded a giveaway.

As for the even strength VS power play goals, you are right that they can be equally valuable over a small stretch. Over a season, though, ES goals correlate more with wins than anything else. A team with a bad power play can make the playoffs if they can score at even strength with the best of em, but you rarely see the opposite. As for individual players, it makes sense to value players more that can still contribute at their usual rate regardless of how many powerplays their team gets in a particular game or season (which can vary greatly.)
 

Ad

Upcoming events

Ad

Ad