Henkka
Registered User
the most accurate formula possible.... No math.
Just my opinion mixed with input in threads on HF.
Ok. Maybe I'll do a math version and then compare.
the most accurate formula possible.... No math.
Just my opinion mixed with input in threads on HF.
I used a mix of both metrics arbitrarily. As in i value players with long careers or good ceilings.
Who was famously "good" but got injured much too fast? 2001-2015?
What were you thinking for an objective, mathed out redraft?Ok. Maybe I'll do a math version and then compare.
Do you mean forwards vs defense or scorers vs defensive specialists? I don't think the latter distinction is all that important. When was the last time anyone was ever drafted in the first round because they were great defensively without scoring a lot? I don't think it happens all that often until the latter rounds. First few rounds most people are trying to pick up someone who puts points up.Well the problem with doing Points is of course overweighting Scorers vs Defensive players
Problem with GP is a Long medium career vs shorter great career.
So there is no "numbers" to use to organize players.
What were you thinking for an objective, mathed out redraft?
Where did the 1.5x come from?
But that's factually wrong. It was a throwaway pick. They didn't expect him to turn into what he did. He just did. That's luck, not drafting talent.
It is luck. The mere fact that we're talking about 1, maybe 2, players out of 25-45 picks turning into anything special for all the teams indicates no one is doing it with any regularity. No regularity = luck. How else do you describe a process where you can't repeat your results? That's called luck.
If you think there are actually scouts out there who can find those elite players in the late rounds via skill and not luck, then why isn't anyone doing it? Outside of the 1st round, no team has shown they can do it. 10 years of drafts, hundreds and hundreds of picks. No one has done it.
You are assuming it's possible to be good at drafting such that you can find those players. That's an assumption you seem unwilling to abandon. Unfortunately that means you're just going to be wrong.
Of course not. That requires data that doesn't exist and couldn't exist, frankly. To determine what was talent and what was luck you'd need to know the minds and discussions of the drafting decision makers. You'd have to hear Hakan Andersson say "That Datsyuk is going to be a 1C. Future Hall of Famer." We're never getting that data if it even exists.
The fact that the number of exceptional, elite talent outside the first round is so tiny is a huge sign that it's luck outside the first round. There's not one single team finding these guys with repeated success. There's a couple teams who got slightly luckier than others and it led to 1-2 more amazing players (IN 10 YEARS OF DRAFTING) and that's all you need. You get 1-2 more great players than everyone else and you can win. A great player can stick around for 15-20 years barring injury. They give you a huge window.
Wings did it. We got lucky and snagged Datsyuk and Zetterberg while we had Lidstrom still. Boom. We're contenders for like 8 years. Since Zetterberg we've drafted what that approaches their level? Larkin's the closest and he's not that close. It's been over 10 years since we drafted Zetterberg and so far we've drafted a single player who projects to be anything close to their level. Kronwall, our last actually good drafted defensemen was over a decade ago as well. It's been over a decade since we drafted any player that might be elite one day outside the 1st round. Hell even including the first round.
Did we just get bad at drafting? No. We were just never good in the first place. Because it's all luck.
Right. Obviously.My biggest issue with this line of thinking is not everyone taken in rounds 2-7 have equal chances at becoming an outlier to begin with. FAR from it. I think some guys realistically pretty much have no chance at ever becoming an outlier.
Pavel Datsyuk and Reilly Webb were both 6th rounders. One guy had a chance (even if it's small) at becoming an impact player, whereas Webb has no chance. So to say it's not in a team's control, or it's just all luck, I can't sign off on it regardless of what the numbers say.
Go back and read the scouting reports on the guys who have become impact players from the later rounds. Were they viewed as unskilled players at 17 and teams just got lucky? With most guys I can think of the answer is no. So while it is incredibly difficult, I think there is a thought process and some strategy to the picks that work out.
I mean, I would try and take one (or two) of these undersized productive forwards every year. That seems to be the trend hitting the most. If you look at the defenseman this year, the most productive guys are also the guys who are ranked highest. Even if they are small. But at forward it's not like that. The league still seems skeptical of doing it with forwards, so I think you can take advantage there. Mix in some bigger guys with your other picks or in free agency. I think Tampa Bay has done something similar to this to an extent with some success.
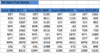
I really like the idea of using TOI as a factor. Shouldn't you use it for forwards too? If Zetterberg and AA both score the same amount of goals in a season, but Z played 3 times the minutes, that says a lot about their difference in importance to the team.Someting I posted earlier ont his topic.
- Forwards, career games (longevity) + career points as goals counted 1.5x. Plus some weight for career peak years which will eaven out the injury factor.
Imo, injuries/accidents later on the career don't have anything to do with pure drafting. Longevity guys are luck. Draft pick can be absolutely great, like Ficher and Konstantinov, but **** just happen afterwards.
- Defencemen, career games + 1.5x career points. Career peak effect based sime way on TOI, which determines defencemen best, imo. 30min D has much greater impact than 20min guy. In general, best guys play most, defensive or offensive.
- Goalies, those crapshoot guys. Career games + wins with some multiplier. They are tough to rank relatively to skaters, because goalies won't play all the games. Have to implement something. Career SV% included in somehow.
I really like the idea of using TOI as a factor. Shouldn't you use it for forwards too? If Zetterberg and AA both score the same amount of goals in a season, but Z played 3 times the minutes, that says a lot about their difference in importance to the team.
")
| RANK | Payer | Team | Pos | CareerTOI | Pts/Gm | TOTAL |
| 1. | Eric Staal | CAR | C | 21692 | 0.844 | 18308 |
| 2. | Ryan Getzlaf | ANA | C | 18096 | 0.954 | 17264 |
| 3. | Corey Perry | ANA | RW | 17441 | 0.800 | 13953 |
| 4. | Patrice Bergeron | BOS | C | 18163 | 0.762 | 13840 |
| 5. | Joe Pavelski | SJS | C | 16753 | 0.785 | 13151 |
| 6. | Zach Parise | NJD | LW | 16175 | 0.786 | 12714 |
| 7. | Thomas Vanek | BUF | W | 15873 | 0.780 | 12381 |
| 8. | Ryan Suter | NSH | LD | 24862 | 0.497 | 12356 |
| 9. | Jeff Carter | PHI | C | 16420 | 0.743 | 12200 |
| 10. | Brent Bruns | MIN | RD | 20658 | 0.589 | 12168 |
| 11. | Shea Weber | NSH | RD | 20945 | 0.578 | 12106 |
| 12. | Dion Phaneuf | CGY | LD | 23591 | 0.497 | 11725 |
| 13. | Dustin Brown | LAK | W | 18616 | 0.543 | 10108 |
| 14. | Dustin Byfuglien | CHI | RD | 18032 | 0.597 | 10765 |
| 15. | Ryan Kesler | VAN | C | 17863 | 0.600 | 10718 |
| 16. | Loui Eriksson | DAL | W | 15333 | 0.656 | 10058 |
| 17. | Brent Seabrook | CHI | RD | 22371 | 0.430 | 9620 |
| 18. | David Backes | STL | C | 15408 | 0.620 | 9553 |
| 19. | Mike Richards | PHI | C | 13515 | 0.650 | 8785 |
| 20. | Milan Michalek | SJS | W | 13091 | 0.600 | 7855 |
| 21. | Lee Stempniak | STL | RW | 14487 | 0.520 | 7533 |
| 22. | Nathan Horton | FLO | RW | 10821 | 0.671 | 7261 |
| 23. | Tobias Enström | ATL | LD | 16363 | 0.430 | 7036 |
| 24. | Matt Moulson | PIT | LW | 10519 | 0.570 | 5996 |
| 25. | Matt Carle | SJS | LD | 15125 | 0.390 | 5899 |
| 26. | Clarke MacArthur | BUF | W | 8581 | 0.550 | 4720 |
| 27. | Nikolay Zherdev | CBJ | RW | 7046 | 0.620 | 4369 |
| 28. | Kyle Brodziak | EDM | C | 12118 | 0.340 | 4120 |
| 29. | Braydon Coburn | ATL | LD | 16956 | 0.241 | 4086 |
| 30. | Andrei Kostitsyn | MTL | W | 6078 | 0.560 | 3404 |
| 31. | Kyle Quincey | DET | LD | 11837 | 0.270 | 3196 |
| 32. | Patrick Eaves | OTT | RW | 8076 | 0.390 | 3150 |
| 33. | Steve Bernier | SJS | RW | 8426 | 0.360 | 3033 |
| 34. | Jan Hejda | BUF | LD | 13244 | 0.220 | 2914 |
| 35. | Kevin Klein | NSH | RD | 11637 | 0.250 | 2909 |
| 36. | David Jones | COL | RW | 6914 | 0.410 | 2835 |
| 37. | Brad Richardson | COL | F | 9193 | 0.300 | 2758 |
| 38. | Eric Fehr | WSH | RW | 7220 | 0.380 | 2744 |
| 39. | Patrick O'Sullivan | MIN | C | 5614 | 0.480 | 2695 |
| 40. | Brian Boyle | LAK | C | 9059 | 0.280 | 2537 |
Just doing some updating... You may find these results comical
Hmm... if you trade all your picks for sixth rounders, you essentially will always get a positive score!
Don't tell Holland...
Hmm, yeah. When Wings don't have high (and failed) 1st rounders, we don't have misses with big minuses and mostly go on plus side.
We have produced a lot of NHL talent from later rounds, and that usually gives OK bonuses, but not huge pluses. Later round "NHL" hits usually 500-700 pts. Unless you draft a Kucherov // Gadreau. So you need a lot of late round hits to come out on top. (you will see when file is done).
If the scoring puts the Wings above the Bruins, for taking a bunch of utter junk and Mantha between 2010-2013, while the Bruins took Seguin and Hamilton, the scoring isn't really representative of reality. Taking Pulk, XO and Jurco shouldn't be big enough 'steals' to outweigh taking actual, good players, even if you took a guy where you 'should have'.
Edited to add: in your screenshot, BinCookin, there's no reason in the world that Ottawa should be so far below the Wings (in the '10-'13 period), in spite of taking by far the best player (Stone in the 6th) that either team selected in that time frame. The collection of late round junk we accumulated just can't outweigh that kind of draft pick, especially given that they had no Yakupov-type picks with their firsts. I posit that the scoring system is badly biased towards accumulating mediocre depth and doesn't reward actual good picks nearly enough, given the results.
| Ottawa | ||||||
| Draft | Draft-# | Player | Redraft-# | Draft Value | ReDraft Value | Overall Score |
| 2013 Entry | 17 | Curtis Lazar | 41 | 750 | 203 | -547 |
| 2013 Entry | 78 | Marcus Hogberg | 97 | 58.5 | 35.75 | -23 |
| 2013 Entry | 102 | Tobias Lindberg | 113 | 32 | 23.5 | -9 |
| 2013 Entry | 108 | Ben Harpur | 56 | 26.5 | 126 | 100 |
| 2013 Entry | 138 | Vincent Dunn | 143 | 12 | 10.2 | -2 |
| 2013 Entry | 161 | Chris Leblanc | 165 | 6 | 5.2 | -1 |
| 2013 Entry | 168 | Quentin Shore | 171 | 4.8 | 4.5 | 0 |
| 2012 Entry | 15 | Cody Ceci | 28 | 830 | 380 | -450 |
| 2012 Entry | 76 | Chris Driedger | 113 | 62 | 23.5 | -39 |
| 2012 Entry | 82 | Jarrod Maidens | 116 | 52.5 | 22 | -31 |
| 2012 Entry | 106 | Tim Boyle | 129 | 28 | 15.6 | -12 |
| 2012 Entry | 136 | Robbie Baillargeon | 152 | 12.8 | 7.8 | -5 |
| 2012 Entry | 166 | Francois Brassard | 173 | 5 | 4.3 | -1 |
| 2012 Entry | 196 | Mikael Wikstrand | 197 | 2.7 | 2.65 | 0 |
| 2011 Entry | 6 | Mika Zibanejad | 12 | 1650 | 960 | -690 |
| 2011 Entry | 21 | Stefan Noesen | 45 | 590 | 179 | -411 |
| 2011 Entry | 24 | Matt Puempel | 70 | 490 | 79 | -411 |
| 2011 Entry | 61 | Shane Prince | 50 | 107 | 154 | 47 |
| 2011 Entry | 96 | Jean-Gabriel Pageau | 27 | 36.5 | 400 | 364 |
| 2011 Entry | 126 | Fredrik Claesson | 64 | 17 | 98 | 81 |
| 2011 Entry | 156 | Darren Kramer | 170 | 7 | 4.6 | -2 |
| 2011 Entry | 171 | Max McCormick | 76 | 4.5 | 62 | 58 |
| 2011 Entry | 186 | Jordan Fransoo | 193 | 3.25 | 2.85 | 0 |
| 2011 Entry | 204 | Ryan Dzingel | 33 | 2.3 | 285 | 283 |
| 2010 Entry | 76 | Jakub Culek | 102 | 62 | 32 | -30 |
| 2010 Entry | 106 | Marcus Sorensen | 127 | 28 | 16.5 | -12 |
| 2010 Entry | 178 | Mark Stone | 6 | 3.8 | 1650 | 1646 |
| 2010 Entry | 196 | Bryce Aneloski | 197 | 2.7 | 2.65 | 0 |
| Draft | Draft-# | Player | Redraft-# | Draft Value | ReDraft Value | Overall Score |
| 2013 Entry | 20 | Anthony Mantha | 10 | 630 | 1050 | 420 |
| 2013 Entry | 48 | Zach Nastasiuk | 78 | 164 | 58.5 | -105.5 |
| 2013 Entry | 58 | Tyler Bertuzzi | 27 | 118 | 400 | 282 |
| 2013 Entry | 79 | Mattias Janmark-Nylen | 29 | 57 | 360 | 303 |
| 2013 Entry | 109 | David Pope | 118 | 25.75 | 21 | -4.75 |
| 2013 Entry | 139 | Mitch Wheaton | 144 | 11.6 | 9.9 | -1.7 |
| 2013 Entry | 169 | Marc McNulty | 172 | 4.7 | 4.4 | -0.3 |
| 2013 Entry | 199 | Hampus Melen | 200 | 2.55 | 2.5 | -0.05 |
| 2012 Entry | 49 | Martin Frk | 52 | 159 | 144 | -15 |
| 2012 Entry | 80 | Jake Paterson | 115 | 55.5 | 22.5 | -33 |
| 2012 Entry | 110 | Andreas Athanasiou | 24 | 25 | 490 | 465 |
| 2012 Entry | 140 | Mike McKee | 154 | 11.2 | 7.4 | -3.8 |
| 2012 Entry | 170 | James De Haas | 176 | 4.6 | 4 | -0.6 |
| 2012 Entry | 200 | Rasmus Bodin | 200 | 2.5 | 2.5 | 0 |
| 2011 Entry | 35 | Tomas Jurco | 49 | 260 | 159 | -101 |
| 2011 Entry | 48 | Xavier Ouellet | 57 | 164 | 122 | -42 |
| 2011 Entry | 55 | Ryan Sproul | 79 | 130 | 57 | -73 |
| 2011 Entry | 85 | Alan Quine | 66 | 48 | 91 | 43 |
| 2011 Entry | 115 | Marek Tvrdon | 135 | 22.5 | 13.2 | -9.3 |
| 2011 Entry | 145 | Philippe Hudon | 162 | 9.6 | 5.8 | -3.8 |
| 2011 Entry | 146 | Mattias Backman | 163 | 9.3 | 5.6 | -3.7 |
| 2011 Entry | 175 | Richard Nedomlel | 184 | 4.1 | 3.35 | -0.75 |
| 2011 Entry | 205 | Alexey Marchenko | 62 | 2.25 | 104 | 101.75 |
| 2010 Entry | 21 | Riley Sheahan | 33 | 590 | 285 | -305 |
| 2010 Entry | 51 | Calle Jarnkrok | 32 | 149 | 300 | 151 |
| 2010 Entry | 81 | Louis-Marc Aubry | 106 | 54 | 28 | -26 |
| 2010 Entry | 111 | Teemu Pulkkinen | 63 | 24.5 | 101 | 76.5 |
| 2010 Entry | 141 | Petr Mrazek | 27 | 10.8 | 400 | 389.2 |
| 2010 Entry | 171 | Brooks Macek | 174 | 4.5 | 4.2 | -0.3 |
| 2010 Entry | 201 | Ben Marshall | 202 | 2.45 | 2.4 | -0.05 |
| Draft-# | Player | Redraft-# | Overall Score |
| 17 | Curtis Lazar | 41 | -547 |
| 108 | Ben Harpur | 56 | 100 |
| 15 | Cody Ceci | 28 | -450 |
| 6 | Mika Zibanejad | 12 | -690 |
| 21 | Stefan Noesen | 45 | -411 |
| 24 | Matt Puempel | 70 | -411 |
| 96 | Jean-Gabriel Pageau | 27 | 364 |
| 204 | Ryan Dzingel | 33 | 283 |
| 178 | Mark Stone | 6 | 1646 |
| 20 | Anthony Mantha | 10 | 420 |
| 48 | Zach Nastasiuk | 78 | -106 |
| 58 | Tyler Bertuzzi | 27 | 282 |
| 79 | Mattias Janmark-Nylen | 29 | 303 |
| 110 | Andreas Athanasiou | 24 | 465 |
| 35 | Tomas Jurco | 49 | -101 |
| 205 | Alexey Marchenko | 62 | 102 |
| 21 | Riley Sheahan | 33 | -305 |
| 51 | Calle Jarnkrok | 32 | 151 |
| 141 | Petr Mrazek | 27 | 389 |
| DET | 1502 |
| OTT | -97 |