
So with the Lightning becoming just the second team to repeat as champions since the 97-98 Detroit Red Wings, I thought about the gap between those Red Wing teams and the Penguins teams in 15-16 and 16-17. So I wanted to quantify every defending champ's probability of repeating. I originally wanted to quantify it in the aggregate of none of them repeating in 16 seasons, but then realized the math wouldn't work. So I have it each year. You'll notice a wide range of probabilities, that's because I treated teams winning rounds as 100% for that round. So the 99-00 Stars that won 3 rounds and lost in the Stanley Cup Final, their probability of winning the cup was just the probability of beating the 99-00 Devils. It wouldn't make sense saying that their probability of winning the cup was say 10%, knowing that they won the first 3 rounds. So a teams' probability increases from not making the playoffs (0%) to winning 3 rounds (prob of winning the Stanley Cup matchup) and everything in between. It's the probability they win the cup given the rounds they already won. For the final, I just chose the actual finalist since that's set in stone. I do realize this is a hybrid method of what actually happened and a forecast, so it's not completely perfect and a bit subjective.
My methodology was using the below formula on regulation wins and losses at home and away (there is no 3 on 3 or 4 on 4 OT or shootout in the playoffs):
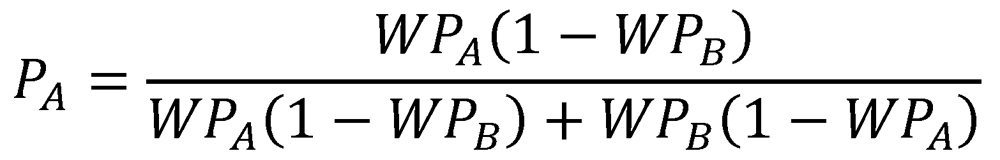
The rest was using probability and combinatorics to determine the odds of a 4 game sweep, 5 game win, 6 game win, and 7 game win. And I modeled out each of the possible scenarios. The math seems to work because if you choose a specific season in a specific conference and add up the probability of all of the seeds in that conference winning 3 rounds (or winning the conference), that probability comes out to 100%.
Here's my final result:

Here's my blog explaining my methodology in more detail:
Probability of Defending Champs repeating as Cup winners from 99-00 through 15-16
Please be kind because this was a ton of work!
My methodology was using the below formula on regulation wins and losses at home and away (there is no 3 on 3 or 4 on 4 OT or shootout in the playoffs):
The rest was using probability and combinatorics to determine the odds of a 4 game sweep, 5 game win, 6 game win, and 7 game win. And I modeled out each of the possible scenarios. The math seems to work because if you choose a specific season in a specific conference and add up the probability of all of the seeds in that conference winning 3 rounds (or winning the conference), that probability comes out to 100%.
Here's my final result:
Here's my blog explaining my methodology in more detail:
Probability of Defending Champs repeating as Cup winners from 99-00 through 15-16
Please be kind because this was a ton of work!
