Game Analysis: Penalty Kill 2020-21

NYR

Registered User
Mar 1, 2002
8,604
2,690
LI
It's a bit goofy. I mean, a spreadsheet might have been easier to see the info but advanced stats = advaaaaanced graphs.
I personally don't understand what % availability means. Is that the % of time they were standing around not actively engaged in the play and thus available or open?

This whole chart thing is a goofy way of measuring the PK and not accurate but carry on..
 

aufheben

#Norris4Fox
Jan 31, 2013
53,569
27,260
New Jersey
Anyway the actual point of this thread is that the team has allowed more PK goals than expected because of goaltending (mostly Shesterkin’s 78.95 PKSV%):

NYR PK% = average
NYR PK SV% = below-average

Sub-point is to keep track of the team’s PK through the remainder of the season.
 
Last edited:
  • Like
Reactions: Mac n Gs

NYR94

Registered User
Mar 31, 2005
14,471
13,980
Long Island, NY
I mean if you guys have a better way to depict this information, by all means, saved me the trouble of copy/pasting back and forth. :laugh:
NclVhDq.jpg
 

nyr2k2

Can't Beat Him
Jul 30, 2005
45,685
32,831
Maryland
I just see a tangle of blue lines that takes more effort than it should to track from hexagon to hexagon. I also can read the legend and I get what it is supposed to show me, it's just really hard for me to look at it and take anything away since it just looks like a jumble of nonsense.

I do not have a better way of presenting the data. I wish other people had a better way of presenting the data to me, as I know I'm far from alone in not understanding the charts. But I guess I'm not the audience.

Anyway, this shit is clearly not for me. Hopefully the PK continues to be better.
 

NYR

Registered User
Mar 1, 2002
8,604
2,690
LI
I mean if you guys have a better way to depict this information, by all means, saved me the trouble of copy/pasting back and forth. :laugh:

No offense but this is a lazy way of making a point
 

NYR

Registered User
Mar 1, 2002
8,604
2,690
LI
1) You absolutely meant this offensively. :laugh:

2) I wasn’t kidding. Post more information about the subject and I’ll add it to the OP. :dunno:

No..I really didn't but if you're gonna actually make a thread dedicated to the PK, add all the info instead of just copy n pasting.
This just isn't accurate so what's the point?

If it were anyone else you would've locked the thread lol
 

Irishguy42

Mr. Preachy
Sep 11, 2015
26,804
19,051
NJ
The charts are pretty easy to read and informational. Reading when you have a guide is simple, and I know Micah doesn't create legends all the time. :dunno:
 

nyr2k2

Can't Beat Him
Jul 30, 2005
45,685
32,831
Maryland
The charts are pretty easy to read and informational. Reading when you have a guide is simple, and I know Micah doesn't create legends all the time. :dunno:
The heat map is straightforward for me, I've seen that presented enough times that I instinctively know what I'm looking at. The bottom charts are also pretty easy, they're just line charts.

It's just the second chart that I struggle with. Partly because I don't think I've ever seen data presented in such a manner and therefore it's unfamiliar, and also because I feel like it's "work" to follow the blue lines from hub to hub. It's looks like a tangled mess. Maybe if there were different colors or markedly different gradients for the lines? Or maybe that would make it worse. I don't know. It just seems messy. It's the only chart I have an issue with.

I guess it's about the audience. I've been pretty open about my "I like analytics but hate analytics charts" stance. I feel like the charts are for people who like analytics charts. So, not me. And that's fine. I've hijacked the thread enough and will now leave. :laugh:
 

Mac n Gs

Gorton plz
Jan 17, 2014
22,587
12,848
Anyway the actual point of this thread is that the team has allowed more PK goals than expected because of goaltending (mostly Shesterkin’s 78.95 PKSV%):

NYR PK% = average
NYR PK SV% = below-average

Sub-point is to keep track of the team’s PK through the remainder of the season.
Can we make this a general special teams thread, and if you have it available, can you add Micah's data from our powerplay?

Otherwise, yeah, you nailed it. Our PK stylistically looks a lot better this year, and I think the most underrated change is finally having sticks consistently occupying passing and shooting lanes. They also are limiting that weird overload and chase scheme when pucks are sent into the corner, which is obviously helping to prevent royal road chances on the weak side.

As to the hotter area at the right net-mouth, we've had some really ugly goals against from breakdowns on that side, but I don't think it'll continue.
 
  • Like
Reactions: Irishguy42

duhmetreE

Blessed Bigly
Sponsor
Jan 18, 2012
33,688
50,610
Updated: 02.03.2021

PK%: 79.41 (16th / Avg. 78.60)
GA: 7
PPAO: 34
PK SV%: 81.58 (26th)

Penalty Kill Unblocked Shot Rates (Against)
NYR

...2019-20 – xG/60: 8.75 (+24%)

Penalty Kill Player Ice-time/Shared Ice-time
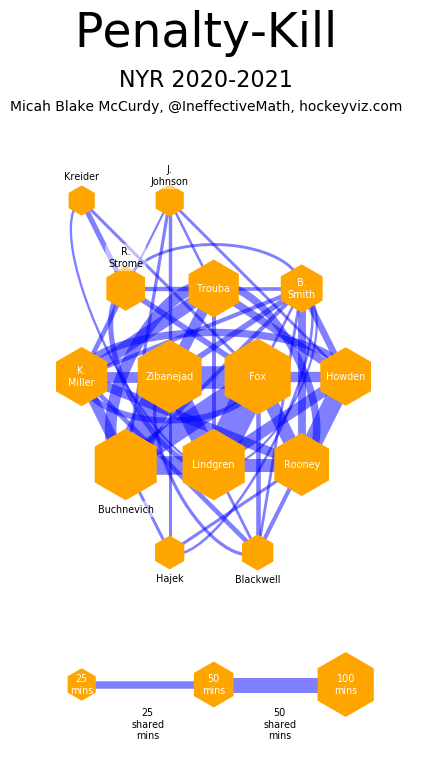
NYR


Game-by-game Special Teams History
NYR

Could we pin this and make it a Special Teams Analysis thread? think it would be good.

Is it possible to merge this past thread? Watch the Tape: Rangers Penalty Kill Stinks

I need to learn how to make gifs so I can become an internet hockey coach
 

Ad

Upcoming events

Ad

Ad

-->