Critical13
Fear is the mind-killer.
I thought it would be nice to have a place where we could discuss some of the non-traditional stats out there, on a game-by-game basis.
The goals of the thread:
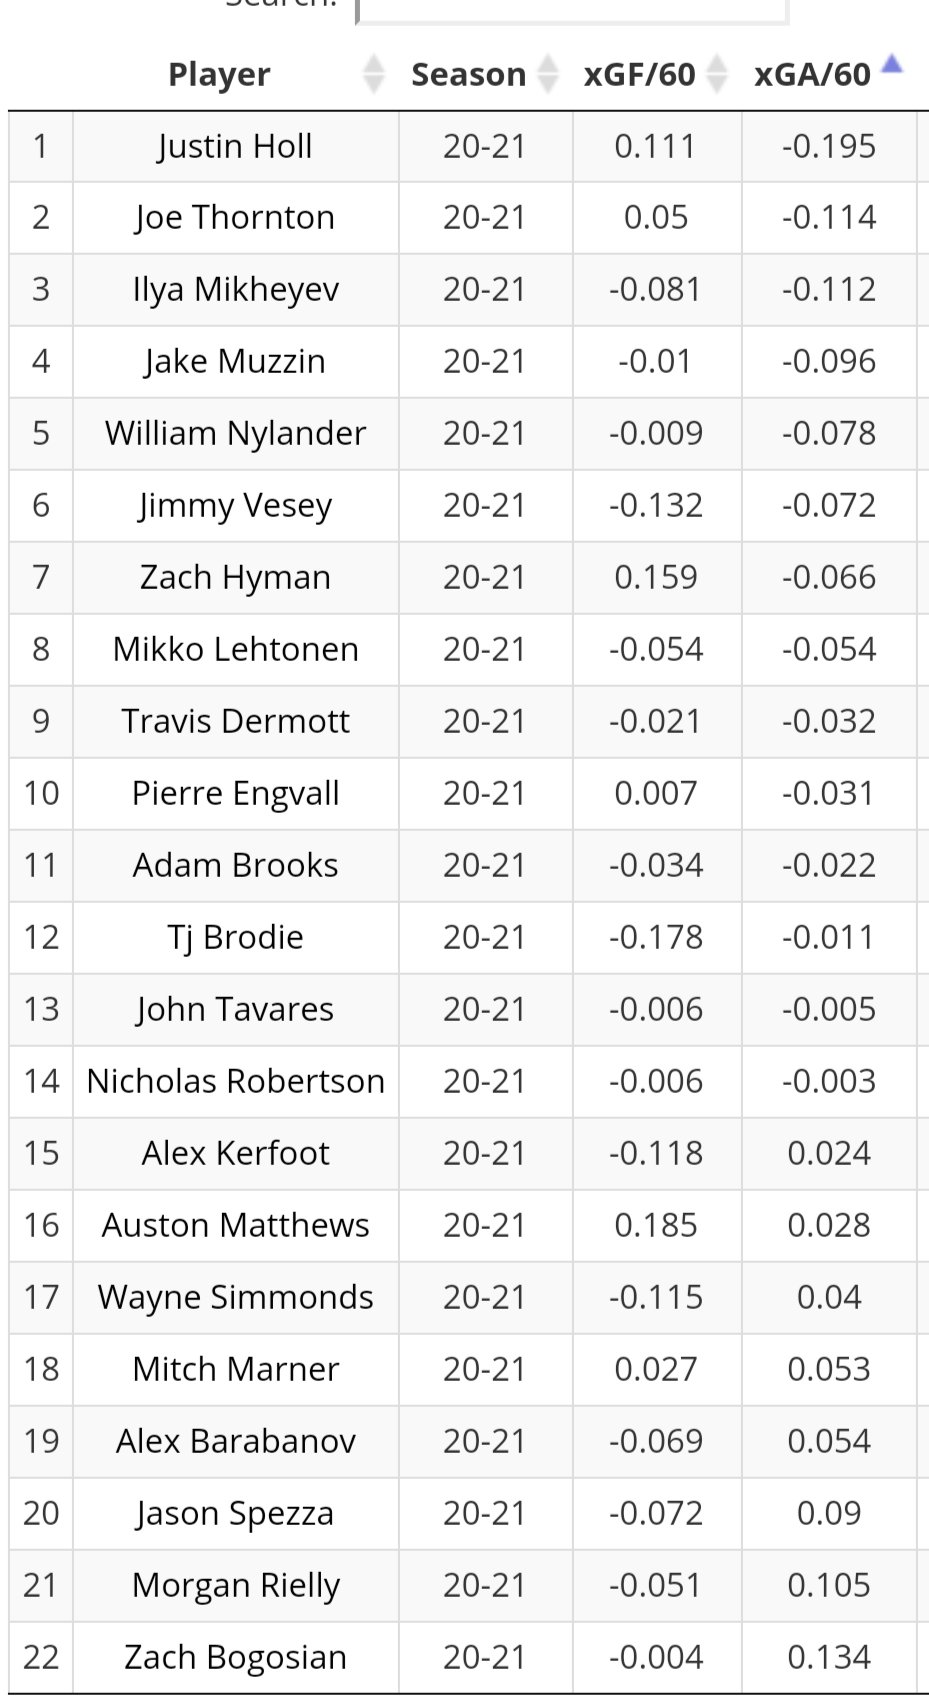
As of Jan 27, 2021:

Higher on the chart means giving up more chances on the defensive side. Further to right means creating more chances offensively. We really want to be in the lower right hand quadrant. I expect us to finish much further to the right.
The goals of the thread:
- Develop a better understanding of where our team stands, including each individual player.
- Help us all keep up to date on various non-traditional stats.
- A judgement-free zone where we can all learn about different stats that are tracked, how to understand and use them to form opinions, with guidance from our more experienced members.
As of Jan 27, 2021:
Higher on the chart means giving up more chances on the defensive side. Further to right means creating more chances offensively. We really want to be in the lower right hand quadrant. I expect us to finish much further to the right.