Goals Above Replacement

nomorekids

The original, baby
Feb 28, 2003
33,375
107
Nashville, TN
www.twitter.com
So, I've been reading up on the concept of GAR, particularly the flavor popularized by @DTMAboutHeart. Overall, I think that this could represent the sort of analytic that has been missing and closes the gap to where baseball is, currently.

For those of you that are familiar...what do you like about it? Dislike?

One thing I'm a little confused by - does it take deployment\assignment into account? For example, if you have an elite "shutdown" type center, his EVO is clearly going to be pretty bad, and frequent DZ deployment is also going to impact his shot suppression EVD numbers -- so wouldn't that skew his cumulative GAR score pretty badly? I'll use the example of Paul Gaustad, who in his time with Nashville, started in the DZ a staggering amount. If you were to calculate his GAR -- even though draws won is a boost -- it probably makes him a replacement level player, though he was useful in ways that GAR doesn't necessarily account for.

What are your thoughts on this?
 

Doctor No

Registered User
Oct 26, 2005
9,250
3,971
hockeygoalies.org
The concept is a good one. I prefer Wins Above Replacement Level, since the ratio of goals to wins varies from season to season (on average, it took more goals to "buy" one win in the 1984-85 NHL season than it does today). With that said, for goaltenders I publish Goals Above Replacement on my site (as opposed to WAR).

Replacement level is the important metric - if you're doing Goals Above Average (or Wins Above Average), then an average player ends up with a value of zero, and as anyone who's been saddled with below-average goaltending in the playoffs can tell you, an "average" level of play has positive value. Alternatively, the fact that GMs consistently pay large sums of money to "average" players is market proof that "average" players have positive value. With Goals Above Replacement, average players get value consistent with their ability.

There are two distinct categorical problems with the Goals Above Replacement calculation - the first problem is that the calculation framework is brilliant, but you still have to actually allocate the values to individual players. The questions you have above regarding specifics - a "yes" or "no" answer isn't sufficient in any case - some methods make adjustments for the things you describe, and others do not (and the ones that adjust do so with varying levels of ability). If a defense allows a high-quality chance and the goaltender whiffs on it, how much of the blame do you allocate to the skaters and how much do you allocate to the goaltender? (And do you even have available the data to discern that?) Conversely, if you're lined up against Wayne Gretzky all game and hold him off the scoresheet with two shots on goal, how many "Goals Above Replacement" is that worth?

By nature of the calculation, some players will have negative GAR for a game (and therefore, it's possible to have more positive GAR in a game than your team scores goals in total).

The other categorical challenge with GAR is the estimation of replacement level. "Replacement level" is typically defined as the best player that a team can insert into the lineup with no meaningful asset expenditure (either players in trade, or dollars in signings). In actual data, the "replacement level" will vary from season to season - and specifically, each team has its own replacement level different from other teams in the league. Most calculations assume a uniform replacement level league-wide, since (for example) it wouldn't be far to penalize Sidney Crosby solely because the Penguins have a star-in-the-waiting available to call up from Wilkes-Barre (and hence have a higher replacement level). This has more of an in-game influence in evaluating goaltenders, since it's always "either/or" when comparing between different goaltenders playing, whereas if Sidney Crosby is injured in a game, the AHL call-up doesn't assume his exact role in its entirety.

If replacement level reflects some sub-NHL level of play, then why do some players have complete seasons where they finish with below-zero GAR? A few reasons (which may be obvious) - a player's past performance is just that, past performance, and teams will often gamble on a player's established history instead of their current season performance. Players also represent an investment, and although sunk costs may be sunk costs, the salary cap environment often necessitates that poor players can't just be replaced. Next, a player may be playing at a below replacement level, but their specific team doesn't have anyone of replacement level value to replace him with. Last but not least, team management are not perfect evaluators and can't always discern below-replacement level play (especially since they're making their decisions concurrently, while we have the luxury of reviewing retrospectively).

TL;DR: The concept of Goals Above Replacement is a solid framework. However, the devil's in the details (or "The Devils Are In The Details" if you're an old school Lou Lam fan) and the individual choices modelers make when developing their own GAR estimates are what separate a good model from something less.
 
Last edited:

lomiller1

Registered User
Jan 13, 2015
6,409
2,967
So, I've been reading up on the concept of GAR, particularly the flavor popularized by @DTMAboutHeart. Overall, I think that this could represent the sort of analytic that has been missing and closes the gap to where baseball is, currently.

For those of you that are familiar...what do you like about it? Dislike?

One thing I'm a little confused by - does it take deployment\assignment into account? For example, if you have an elite "shutdown" type center, his EVO is clearly going to be pretty bad, and frequent DZ deployment is also going to impact his shot suppression EVD numbers -- so wouldn't that skew his cumulative GAR score pretty badly? I'll use the example of Paul Gaustad, who in his time with Nashville, started in the DZ a staggering amount. If you were to calculate his GAR -- even though draws won is a boost -- it probably makes him a replacement level player, though he was useful in ways that GAR doesn't necessarily account for.

What are your thoughts on this?

This is the biggest misunderstanding with Analytics in general. Most player deployment wrt to zone & competition is VERY similar. While these can heavily impact a player’s numbers when they face tough deployments there are no players who actually face tough enough deployment to seriously effect even the simpler analytics. What really skews a player’s numbers is what teammates they are on the ice with.

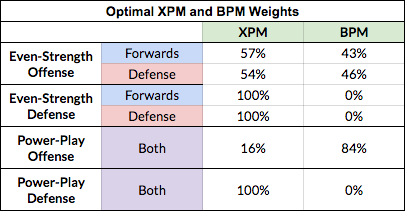
In answer to the question, yes GAR takes Zone starts, team mates and competition in to account. In fact it takes their competition’s competition into account. The largest component of GAR is something called Expected Plus Minis (not to be confused with the NHL +/- stat), XPM calculates the expected number of goals for and goals against while that player is on the ice. It does this by looking at shot attempts what type of shot it was, who was shooting, where the shot was taken from, whether it was a rebound, whether it was on the rush, and a few other things. It calculates the chance of each shot becoming a goal and uses a statistical technique called a Ridge Regression to allocate a part of that to each player on the ice. When you add all these factions of a chance at a goal up for a player what you get is the total number of goals for and against that can be attributed to that player.

I’m not qualified to comment on the mathematical validity in this context, but the point of using the Ridge Regression is look at each player on the ice for both teams when a shot attempt is made in the context of all shot attempts made by all teams that season and assign a share of responsibility for that shot attempt. This is where things like QoC and QoT are accounted for. Players that consistently improve the performance of the payers around them get allocated a bigger share of shots for or smaller share of shots against.

A couple things to remember. XPM is the largest single part of GAR and makes up more than half the final score but there are a number of other components. XPM is, at present the best predictor of future success both is goals for/against and wins. Previous track record is used as a “seed†so players with a history of success start the season assuming they will perform similarly to what they have shown in the past. Due to the use of the Ridge Regression the allocation of responsibility for shot attempts is the best fit to the current data, there are many cases where it hinges on small samples sizes so it can change a lot as new data is introduced.

An example of that last point is the XPM scores for the various Jets defenders. For the first 2/3 of the season Rookie Josh Morrissey was paired with Dustin Byfuglien and after he returned from his holdout Jake Trouba was paired with Toby Enstrom. Both pairs looked good but by the eye test both Enstrom and Buff were not playing as well as they had in the past, Trouba was fantastic and Morrissey was having a really good first season.

Until the pairing were juggled about 2/3 of the way through the season, XPM had Buff in the top 10 of NHL D and Morrissey near the bottom end of top 4 D. Trouba was in the 20-30 range and Enstrom was looking like #3 in spite of visually struggling at times. While this matches the previous track records of the players, to an observer Buff/Enstrom were not playing as well as in the past. When the pairings were juggled so Morrissey was with Trouba and Buff with Enstrom the numbers started to shift very quickly. Morrissey received a lot more credit for the success of when he was paired with Buff, and Buff dropped in response. Similar things happened with Trouba/Enstrom. By season end of the season Buff dropped from top 10 to 30-60(#2D) Morrissey climbed from ~120 to the 30-60 range (#2D), Enstrom dropped from 60-90 (#3D) to 90-120(#4D) and Trouba climbed to top 5 overall.

So basically while Buff and Morrissey were successful the model incorrectly attributed most of that success to Byfuglien based on previous track record. When it got more data on Morrissey paired with someone else it shifted very to a very different attribution and score. The takeaways here is twofold, first the numbers can shift quickly when more data is available, second attribution between teams mates can be flawed if they play together nearly all the time. IOW if it doesn’t have enough data on how certain players perform apart if can make flawed conclusions about who is responsible for their mutual success or lack of success.

The other big issue is that the Ridge Regression is in some respects a black box to a casual observer. You can’t always intuitively see why it produces the results it does so when it produces something unexpected you can’t easily tell if it’s seeing something real that was being missed with less comprehensive techniques or whether it’s the type of mistake in attribution.
 

lomiller1

Registered User
Jan 13, 2015
6,409
2,967
To clarify, you're describing one very specific approach to calculating Goals Above Replacement.

I mentioned that a couple times :) It is, however, the largest part by quite a lot. It’s larger than everything else combined.
https://hockey-graphs.com/2016/10/27/extras-blending-seasonal/


screen-shot-2016-10-20-at-2-58-05-pm.png


And the subcomponents that make up BPM
https://hockey-graphs.com/2016/10/26/introducing-box-plus-minus/

Explanatory Variables
◾The relevant box score metrics:

◾Offensive BPM
◾Individual Goals per 60
◾First Assists per 60
◾Second Assists per 60
◾Individual Expected Goals per 60
◾Individual Fenwick (unblocked shots) For per 60
◾Individual Expected Fenwick Shooting Percentage per 60
◾Quality of Teammates
◾Giveaways
◾Takeaways​

◾Defensive BPM
◾Giveaways
◾Takeaways
◾Blocked Shots
◾Hits For
◾Hits Against​
 

Doctor No

Registered User
Oct 26, 2005
9,250
3,971
hockeygoalies.org
You didn't mention what I'm referring to multiple times (or at all), and saying that "it's the largest part" isn't an answer that addresses what I'm discussing, so my conclusion is that you're talking about something different than I'm talking about.

Let me try, simpler:

There are multiple methods to calculate the Goals Above Replacement statistic. You are describing (in depth) one of those methods (but only one) - to your credit, you're discussing DTMAboutHeart's method, which was the one cited specifically in the original post.

More clear?
 

Ad

Upcoming events

Ad

Ad