All-Purpose Advanced Stats, Player Usage, etc. Thread
- Thread starter Zip15
- Start date
You are using an out of date browser. It may not display this or other websites correctly.
You should upgrade or use an alternative browser.
You should upgrade or use an alternative browser.
Jim Bob
RIP RJ
https://www.biosteel.com/en/the-genesis-of-bioanalytics-in-the-nhl-2
Here is an interesting look at bioanalytics and hockey.
Here is an interesting look at bioanalytics and hockey.
Push Dr Tracksuit
Gerstmann 3:16
- Jun 9, 2012
- 13,237
- 3,315
So the last project in the Analyzing the NHL Organization class I'm taking this summer is to look at NHL rosters using some advanced metrics. I've been looking through the effect on individual Corsi based on how much a team leads or trails. Basically, when a team is in the lead Corsi falls significantly and when they are trailing it goes up. For example Risto's Corsi leading 5v5 is 41.0 and when trailing it is 48.2; Cam Fowler's are 42.6 and 52.6; Jonas Brodin 38.5 and 50.2; PK Subban 48.3 and 58.8. There's a stat to track it called SAwSH (score adjusted weighted shots) or SAC (score adjusted corsi). I was wondering if anyone knows of a cite that specifically tracks those stats or do I need to do the calculations myself?
jc17
Registered User
- Jun 14, 2013
- 11,031
- 7,760
So the last project in the Analyzing the NHL Organization class I'm taking this summer is to look at NHL rosters using some advanced metrics. I've been looking through the effect on individual Corsi based on how much a team leads or trails. Basically, when a team is in the lead Corsi falls significantly and when they are trailing it goes up. For example Risto's Corsi leading 5v5 is 41.0 and when trailing it is 48.2; Cam Fowler's are 42.6 and 52.6; Jonas Brodin 38.5 and 50.2; PK Subban 48.3 and 58.8. There's a stat to track it called SAwSH (score adjusted weighted shots) or SAC (score adjusted corsi). I was wondering if anyone knows of a cite that specifically tracks those stats or do I need to do the calculations myself?
http://www.corsica.hockey/skaters/
This is the best I could find, I don't know if you can use it though. If you do to the adjustments tab you can adjust by score and venue but not just score. Venue refers to whether the game is home or away, not a specific arena.
eperry
Registered User
- Jun 27, 2016
- 64
- 9
So the last project in the Analyzing the NHL Organization class I'm taking this summer is to look at NHL rosters using some advanced metrics. I've been looking through the effect on individual Corsi based on how much a team leads or trails. Basically, when a team is in the lead Corsi falls significantly and when they are trailing it goes up. For example Risto's Corsi leading 5v5 is 41.0 and when trailing it is 48.2; Cam Fowler's are 42.6 and 52.6; Jonas Brodin 38.5 and 50.2; PK Subban 48.3 and 58.8. There's a stat to track it called SAwSH (score adjusted weighted shots) or SAC (score adjusted corsi). I was wondering if anyone knows of a cite that specifically tracks those stats or do I need to do the calculations myself?
Micah McCurdy's score-adjustment method is detailed here: http://hockeyviz.com/txt/shiftsArticle/senstats.html
http://www.corsica.hockey/skaters/
This is the best I could find, I don't know if you can use it though. If you do to the adjustments tab you can adjust by score and venue but not just score. Venue refers to whether the game is home or away, not a specific arena.
I use McCurdy's method on the site. If you download the raw Play-By-Play files you'll find the weighted value of all shot events. "weight2" columns are McCurdy-adjusted (score and venue) and "weight1" are additionally adjusted for zone starts. The prefixes indicate which shot class the weight corresponds to, where c = Corsi, f = Fenwick, etc.
Giving this a bump. Was just perusing Corsica, and some of the highlights (score, venue, zone adjusted):
-Over 50% in CF% (50.48%), which is good for 12th in the league
-11th in league in Scoring Chances For(SCF)/60
-7th in league in Scoring Chances Against(SCA)/60
-7th in league in Relative (to opponent) SCF% (54.55%)
Encouraging numbers for sure, especially without Jack and Kane.
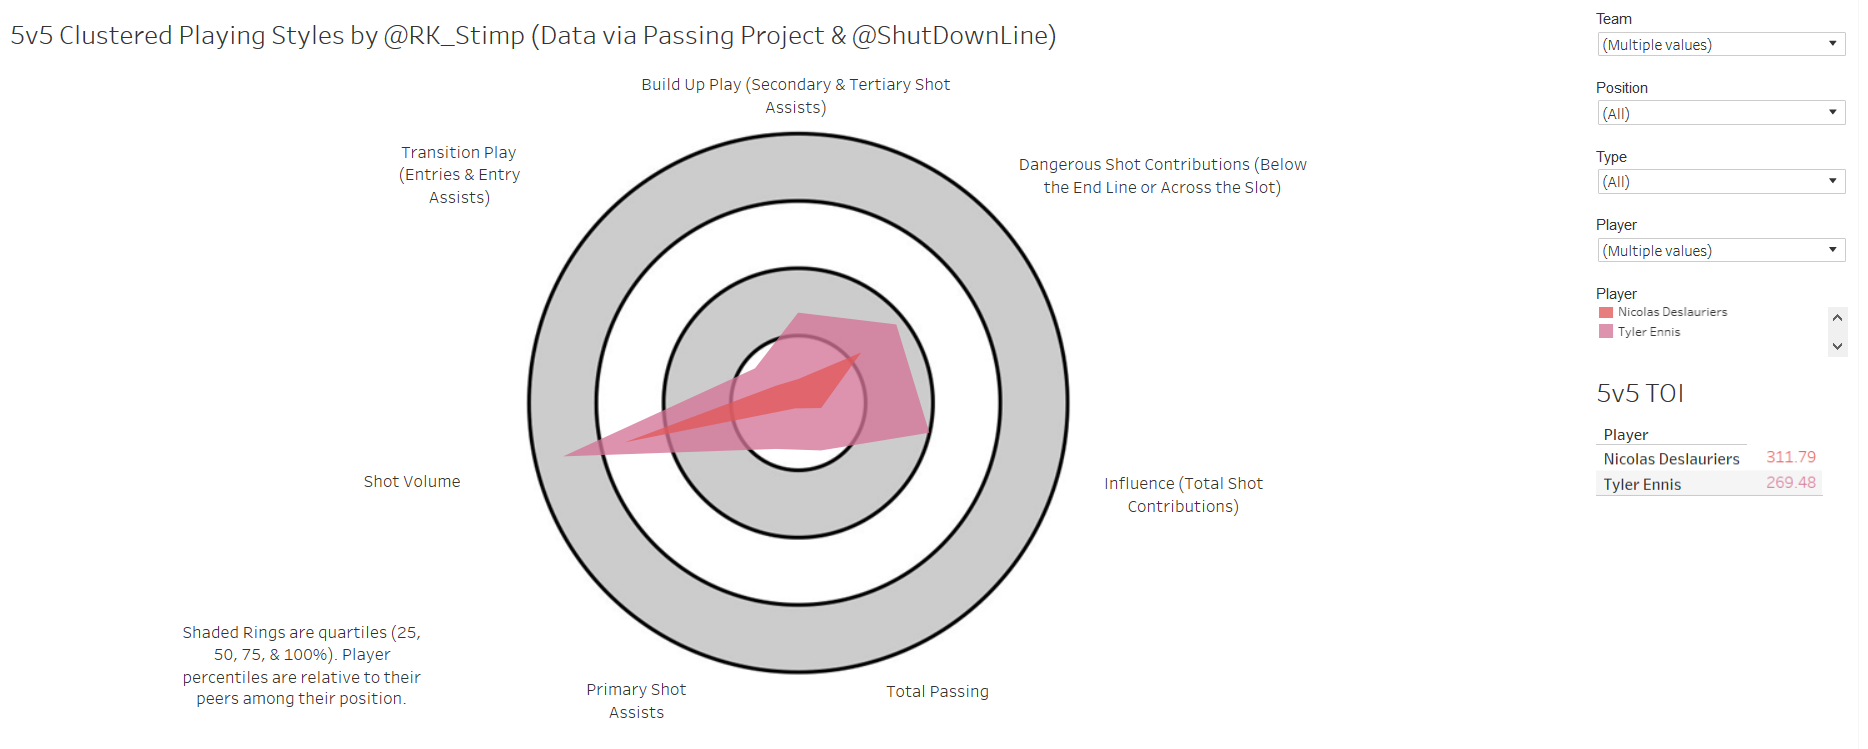
On the flip side, Nic Deslauriers has, by far, the worst CF% in the NHL at 30.68% (min. 50 ES minutes). The next closest skater is Eric Fehr at 36.31%, nearly six full percentage points ahead of Des. There is truly no reason for Des to ever appear in a Sabres jersey again, especially what some of the young guys have shown. Also, Gorges is about where you'd expect him as the 4th worst CF% defenseman in the league (min. 100 minutes).
-Over 50% in CF% (50.48%), which is good for 12th in the league
-11th in league in Scoring Chances For(SCF)/60
-7th in league in Scoring Chances Against(SCA)/60
-7th in league in Relative (to opponent) SCF% (54.55%)
Encouraging numbers for sure, especially without Jack and Kane.
On the flip side, Nic Deslauriers has, by far, the worst CF% in the NHL at 30.68% (min. 50 ES minutes). The next closest skater is Eric Fehr at 36.31%, nearly six full percentage points ahead of Des. There is truly no reason for Des to ever appear in a Sabres jersey again, especially what some of the young guys have shown. Also, Gorges is about where you'd expect him as the 4th worst CF% defenseman in the league (min. 100 minutes).
Jim Bob
RIP RJ
http://www.pensionplanpuppets.com/2...etical-framework-for-optimizing-forward-lines
If someone put that on a website.....

A Theoretical Framework for Optimizing Forward Lines
If someone put that on a website.....
Aladyyn
they praying for the death of a rockstar
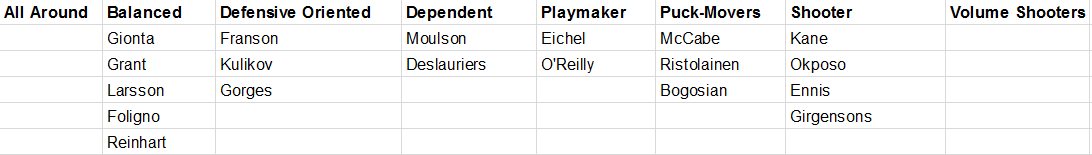
https://hockey-graphs.com/2017/04/04/identifying-player-types-with-clustering/
Ryan Stimson made a new toy based on his passing project, looking into how different types of players contribute to offense and what combinations of these types are the most effective.
Most of the data is from last season but there is some from this year as well. Here's how Sabres players stack up:
Ryan Stimson made a new toy based on his passing project, looking into how different types of players contribute to offense and what combinations of these types are the most effective.
Most of the data is from last season but there is some from this year as well. Here's how Sabres players stack up:
https://hockey-graphs.com/2017/04/04/identifying-player-types-with-clustering/
Ryan Stimson made a new toy based on his passing project, looking into how different types of players contribute to offense and what combinations of these types are the most effective.
Most of the data is from last season but there is some from this year as well. Here's how Sabres players stack up:
No big surprises there... although, i wonder why Kane didn't fall in the volume shooter bucket.
Aladyyn
they praying for the death of a rockstar
No big surprises there... although, i wonder why Kane didn't fall in the volume shooter bucket.
Volume shooter is for defensemen. The names aren't very clear and could use some work.
Jim Bob
RIP RJ
No big surprises there... although, i wonder why Kane didn't fall in the volume shooter bucket.
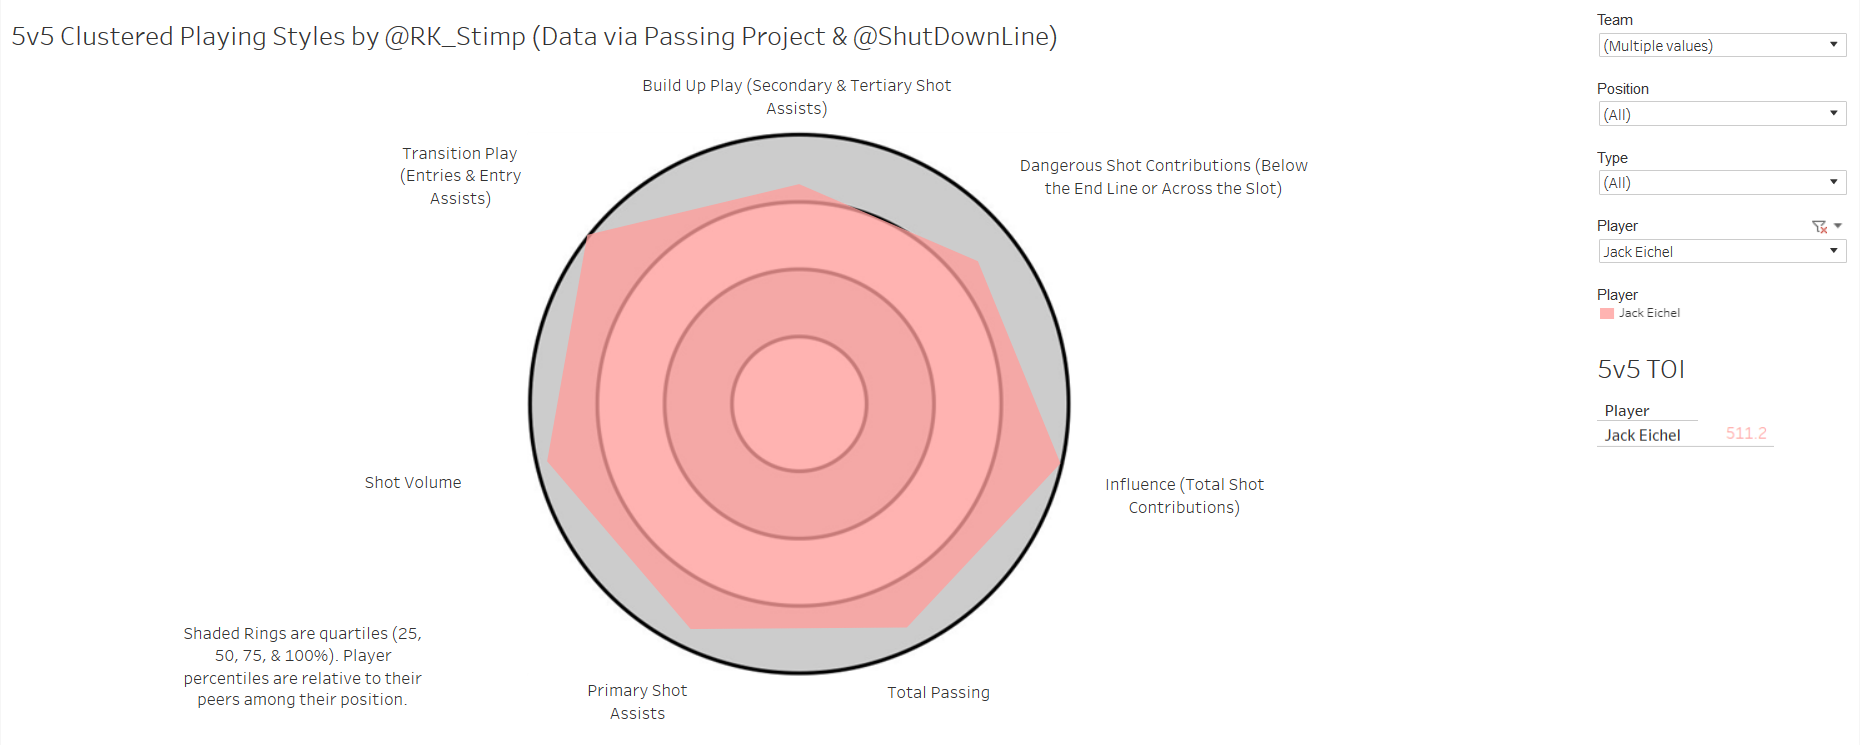
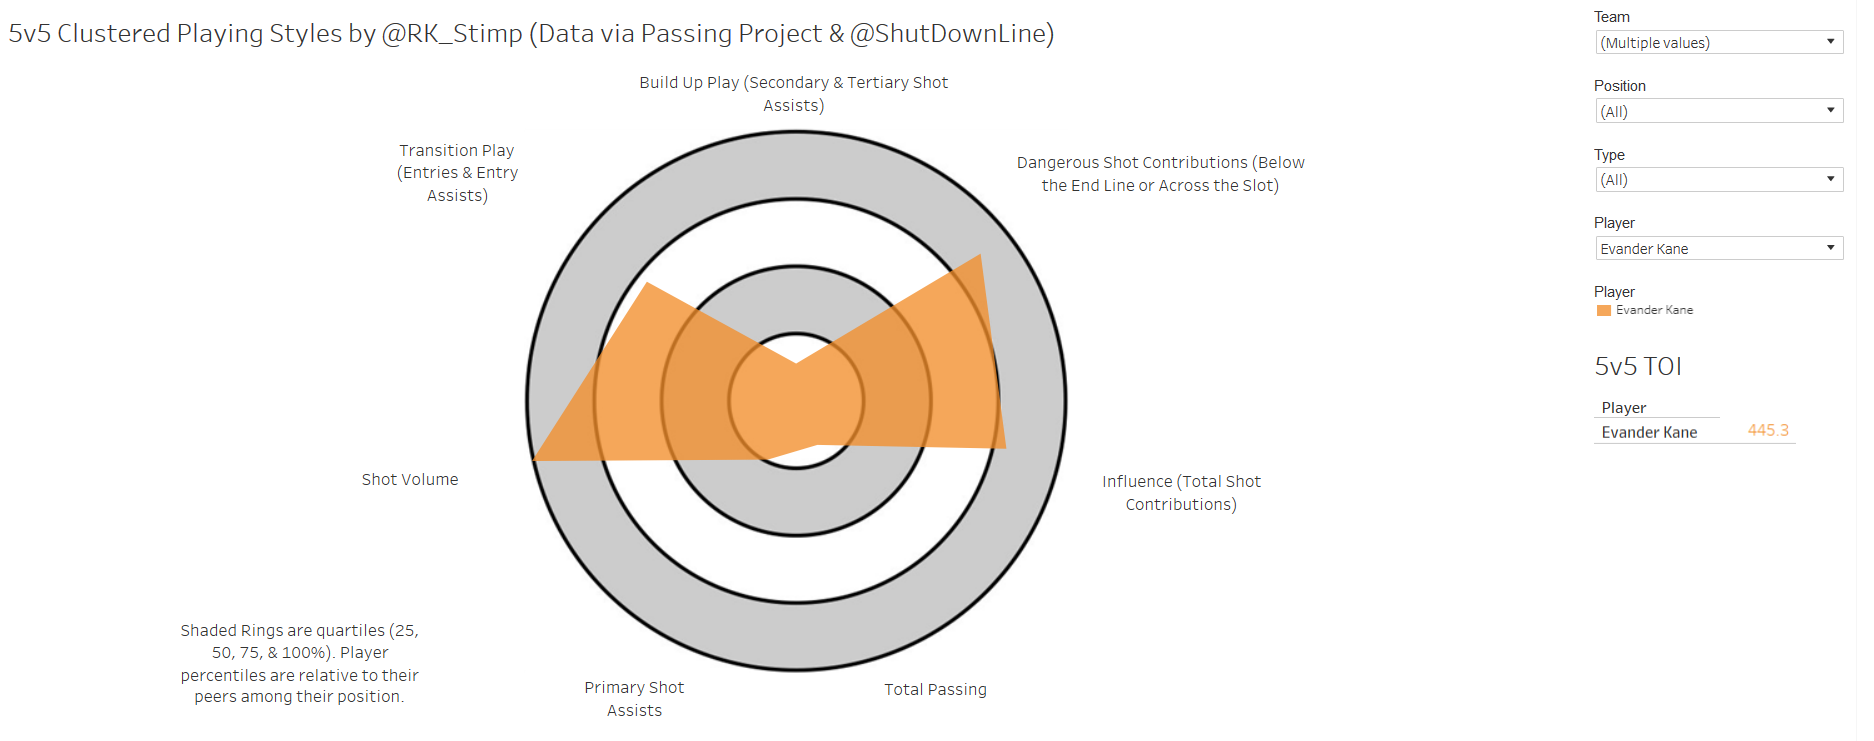
Well, Eichel gets listed as a playmaker and he only has 46 fewer SOG over the past two seasons than Kane.
Aladyyn
they praying for the death of a rockstar
Well, Eichel gets listed as a playmaker and he only has 46 fewer SOG over the past two seasons than Kane.
To be fair, Eichel is just an all-around offensive beast, a very different player compared to Kane.
Eichel
Kane
Aladyyn
they praying for the death of a rockstar
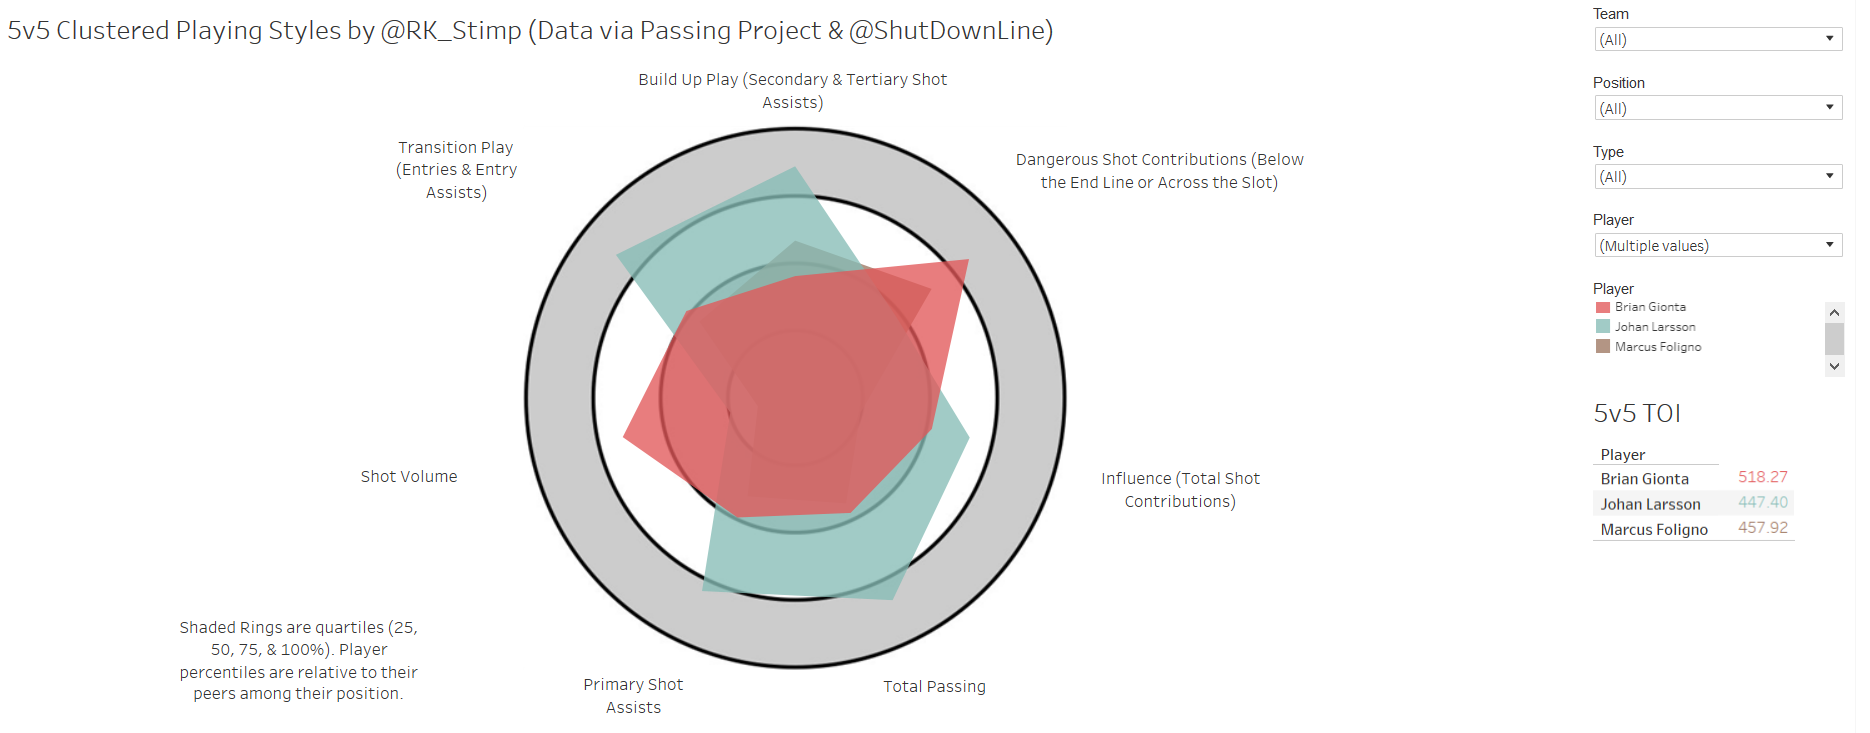
A couple more snapshots
one of these players is being paid 4.6M
offensively, FLG is more like 0LG
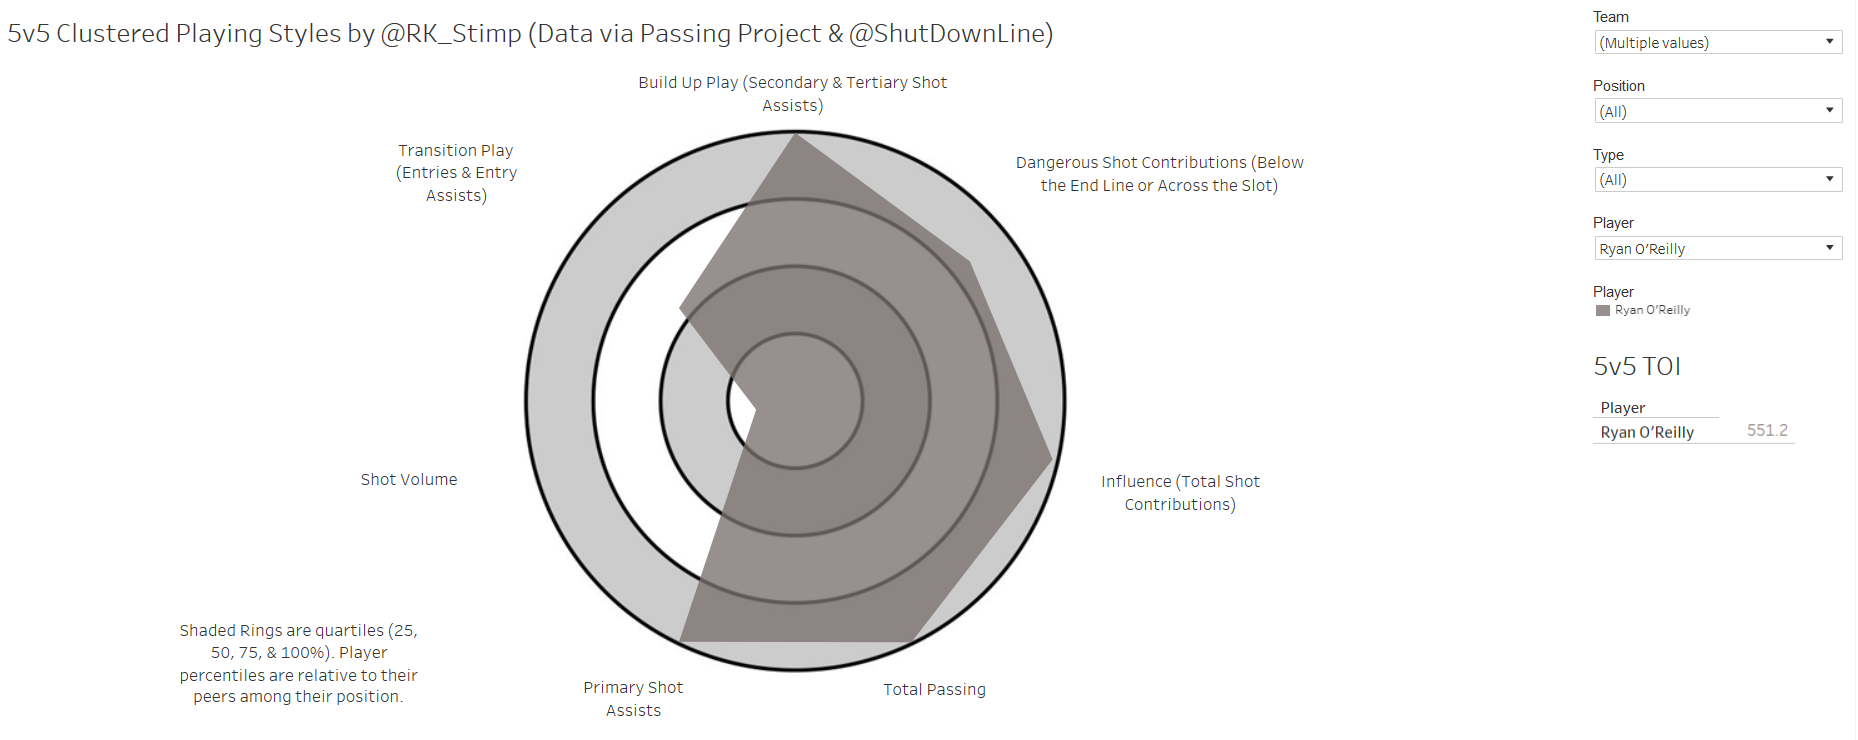
someone tell ROR to shoot more
edit:
one more straight from the article; Chris Tanev, ladies and gentlemen

one of these players is being paid 4.6M
offensively, FLG is more like 0LG
someone tell ROR to shoot more
edit:
one more straight from the article; Chris Tanev, ladies and gentlemen
Last edited:
A couple more snapshots
one of these players is being paid 4.6M
offensively, FLG is more like 0LG
someone tell ROR to shoot more
edit:
one more straight from the article; Chris Tanev, ladies and gentlemen
Thanks for sharing.
Remember when the narrative was "Foligno is the driver of the FLG line".... glad that died an appropriate death.
And the impact of Tanev....
especially when compared to Ristolainen....

It's nice to see something that represents the influence/impact guys like Reinhart and Larsson have.
Der Jaeger
Generational EBUG
https://public.tableau.com/shared/59H5YS6M9?:display_count=yes
Looks like Reinhart is developing into ROR.
(I can't put the image in from my work computer, if a mod could assist).
Sabretooth
Registered User
https://public.tableau.com/shared/59H5YS6M9?:display_count=yes
Looks like Reinhart is developing into ROR.
(I can't put the image in from my work computer, if a mod could assist).
Not the imbedded image but here's both of them on the same Radar plot
https://public.tableau.com/shared/9BQD5BWZR?:display_count=no
joshjull
Registered User
AustonsNostrils
Registered User
- Apr 5, 2016
- 7,409
- 2,533

Jim Bob
RIP RJ
http://www.stack.com/a/the-atlanta-...sletter&utm_medium=email&utm_content=05-11-17
This is an interesting exercise.
The Atlanta Falcons have a metric they call Competitive Toughness that they are trying to use to measure intangibles.
This is an interesting exercise.
The Atlanta Falcons have a metric they call Competitive Toughness that they are trying to use to measure intangibles.
Heraldic
Registered User
- Dec 12, 2013
- 2,937
- 51
https://hockey-graphs.com/2017/04/04/identifying-player-types-with-clustering/
Ryan Stimson made a new toy based on his passing project, looking into how different types of players contribute to offense and what combinations of these types are the most effective.
Most of the data is from last season but there is some from this year as well. Here's how Sabres players stack up:
The problem with this data seems to be this:
All data is from 5v5 situations from the 2015 – 2016 and current season
And the sample size for example for Matthews is only about 250 minutes - out of his all almost 1200.
This is pretty interesting tool (assuming the data is collected correctly), but with the sample size being so random with a pretty wide time frame, it is still pretty limited for an actual use.
Thanks for sharing.
Remember when the narrative was "Foligno is the driver of the FLG line".... glad that died an appropriate death.
Not surprised that you bursted out here with your agendas first... But considering that the time frame of "Foligno driving the line" was the start of the passing season, and that Foligno has been more or less worse outside of that time frame, that data proves pretty much nothing (because the data is collected from random games (we have no idea which ones) during 2015-2017). That data might prove something, if you could isolate the whole sample from that given timeframe. But you can't.
If something, this seems to be another great display of your lack of competency regarding statistics.
Your positions display your lack of competency regarding hockey.
Aladyyn
they praying for the death of a rockstar
Just out of curiosity, where is everyone going for individual player stat breakdowns now that puckalytics has gone dark? I can't seem to find WOWY breakdowns anywhere else...
puckiq.com, only for last season though
Sabre the Win
Joke of a Franchise
- Jun 27, 2013
- 12,262
- 4,950
These charts you guys are all showing, I tried to get one to work and it wasn't happening. Boston fans seem to think Pasternak is on the level of Eichel. I am curious to see Eichel vs Pasternak, can someone do that.
Eichel vs Mathews.
Ad
Upcoming events
-

-

-
 Game 2 Washington Capitals @ New York Rangers - NYR leads series 1-0Wagers: 12Staked: $35,700.00Event closes
- Updated:
-
-