2018-19 NHL TV ratings
- Thread starter sctvman
- Start date
You are using an out of date browser. It may not display this or other websites correctly.
You should upgrade or use an alternative browser.
You should upgrade or use an alternative browser.
- Status
- Not open for further replies.
Coinneach
Registered User
NHL 2018/2019 TV ratings
NBC:
11/23/2018 NY Rangers/Philadelphia 1.3M
01/01/2019 Boston/Chicago 2.9M
01/20/2019 Washington/Chicago 1.2M
02/02/2019 Chicago/Minnesota - Tampa Bay/NY Rangers 1.1M
02/03/2019 Boston/Washington 1.0M
02/10/2019 St. Louis/Nashville 0.9M
02/17/2019 NY Rangers/Pittsburgh 1.1 M
02/17/2019 St. Louis/Minnesota 0.9M
02/23/2019 Pittsburgh/Philadelphia 1.9M
03/03/2019 Washington/NY Rangers 1.3M
03/24/2019 Philadelphia/Washington 0.7M
03/31/2019 NY Rangers/Philadelphia 0.8M
Average: 1.3M
NBCSN:
10/3/2018 Boston/Washington 633k
10/3/2018 Anaheim/San Jose 338k
10/4/2018 Nashville/NY Rangers 194k (non-exclusive)
10/4/2018 Philadelphia/Vegas 227k (non-exclusive)
10/9/2018 San Jose/Philadelphia 249k
10/10/2018 Vegas/Washington 543k
10/16/2018 Arizona/Minnesota 197k
10/17/2018 NY Rangers/Washington 329k
10/17/2018 Boston/Calgary 162k
10/19/2018 Minnesota/Dallas 196k
10/23/2018 San Jose/Nashville N/A
10/24/2018 Toronto/Winnipeg 167k
10/24/2018 Tampa Bay/Colorado 177k
10/30/2018 Vegas/Nashville 227k
11/01/2018 Winnipeg/Florida N/A
11/06/2018 Edmonton/Tampa Bay N/A
11/07/2018 Pittsburgh/Washington 642k
11/07/2018 Nashville/Colorado 222k
11/13/2018 Tampa Bay/Buffalo 243k
11/14/2018 St. Louis/Chicago 407k
11/14/2018 Anaheim/Vegas 230k
11/20/2018 Edmonton/San Jose N/A (non-exclusive)
11/21/2018 Philadelphia/Buffalo 290k (non-exclusive)
11/23/2018 Chicago/Tampa 160k (non-exclusive)
11/27/2018 Vegas/Chicago 189k (non-exclusive)
11/28/2018 St. Louis/Detroit 293k
11/28/2018 Pittsburgh/Colorado 281k (non-exclusive)
12/03/2018 Toronto/Buffalo 286k
12/05/2018 Edmonton/St. Louis 262k
12/05/2018 Chicago/Anaheim 125k (non-exclusive)
12/11/2018 Detroit/Washington 174k (non-exclusive)
12/12/2018 Pittsburgh/Chicago 519k
12/18/2018 Nashville/Chicago 140k (non-exclusive)
12/19/2018 Pittsburgh/Washington 697k
12/21/2018 Buffalo/Washington 278k (non-exclusive)
12/22/2018 Los Angeles/San Jose 192k
12/27/2018 Philadelphia/Tampa 248k
01/02/2019 Pittsburgh/NY Rangers 472k
01/02/2019 San Jose/Colorado 241k
01/03/2019 Chicago/NY Islanders 288k (non-exclusive)
01/06/2019 Chicago/Pittsburgh 474k
01/07/2019 Los Angeles/San Jose 109k
01/08/2019 Philadelphia/Washington 192k (non-exclusive)
01/09/2019 Nashville/Chicago 379k
01/10/2019 Winnipeg/Minnesota 245k
01/14/2019 Montreal/Boston 345k
01/15/2019 Los Angeles/Minnesota 207k
01/16/2019 Boston/Philadelphia 402k
01/16/2019 San Jose/Arizona 185k
01/17/2019 Chicago/NY Rangers 162k (non-exclusive)
01/21/2019 St.Louis/Los Angeles 133k (afternoon game)
01/22/2019 Detroit/Edmonton 214k
01/23/2019 Washington/Toronto 292k
01/23/2019 Nashville/Vegas 220k
01/28/2019 Winnipeg/Philadelphia 195k (non-exclusive)
01/29/2019 Philadelphia/NY Rangers 352k (non-exclusive)
01/30/2019 Tampa Bay/Pittsburgh 494k
02/06/2019 Boston/NY Rangers 428k
02/10/2019 Toronto/NY Rangers 304k
02/11/2019 Pittsburgh/Philadelphia 262k (non-exclusive)
02/12/2019 Chicago/Boston 158k (non-exclusive)
02/13/2019 Edmonton/Pittsburgh 393k
02/17/2019 Philadelphia/Detroit 421k
02/18/2019 Columbus/Tampa Bay 281k
02/18/2019 Boston/San Jose 184k (non-exclusive)
02/19/2019 Toronto/St. Louis 288k
02/20/2019 Chicago/Detroit 500k
02/20/2019 Boston/Vegas 312k
02/21/2019 Los Angeles/Nashville 157k
02/24/2019 St. Louis/Minnesota 477k
02/25/2019 Los Angeles/Tampa Bay 294k
02/26/2019 Buffalo/Philadelphia 259k (non-exclusive)
02/27/2019 Tampa Bay/NY Rangers 379k
02/27/2019 Chicago/Anaheim 223k (non-exclusive)
02/28/2019 Tampa Bay/Boston 509k
03/03/2019 Nashville/Minnesota 449k
03/05/2019 Minnesota/Nashville 310k
03/06/2019 Washington/Philadelphia 373k
03/06/2019 St.Louis/Anaheim 204k
03/07/2019 Columbus/Pittsburgh 229k (non-exclusive)
03/10/2019 Boston/Pittsburgh 715k
03/10/2019 Los Angeles/Anaheim 263k
03/11/2019 San Jose/Minnesota 344k
03/12/2019 Washington/Pittsburgh 272k (non-exclusive)
03/13/2019 Chicago/Toronto 371k
03/13/2019 New Jersey/Edmonton 159k
03/17/2019 Philadelphia/Pittsburgh 707k
03/17/2019 Edmonton/Vegas 269k
03/19/2019 Washington/New Jersey 135k (non-exclusive)
03/20/2019 Tampa Bay/Washington 451k
03/20/2019 Winnipeg/Anaheim 172k
03/24/2019 Colorado/Chicago 339k
03/25/2019 Nashville/Minnesota 288k
03/26/2019 Carolina/Washington 278k (non-exclusive)
03/27/2019 NY Rangers/Boston 457k
03/27/2019 Vegas/Colorado 332k
03/31/2019 Boston/Detroit 363k
04/01/2019 Colorado/St. Louis 365k
04/02/2019 Boston/Columbus 204k (non-exclusive)
04/03/2019 St. Louis/Chicago 352k
04/04/2019 Montreal/Washington 161k (non-exclusive)
Cable average: 304k
Next:
PLAYOFFS
Coinneach
Registered User

Coinneach
Registered User
SwaggySpungo
Registered User
- Oct 18, 2018
- 768
- 969
NHL 2018/2019 TV ratings
NBC:
11/23/2018 NY Rangers/Philadelphia 1.3M
01/01/2019 Boston/Chicago 2.9M
01/20/2019 Washington/Chicago 1.2M
02/02/2019 Chicago/Minnesota - Tampa Bay/NY Rangers 1.1M
02/03/2019 Boston/Washington 1.0M
02/10/2019 St. Louis/Nashville 0.9M
02/17/2019 NY Rangers/Pittsburgh 1.1 M
02/17/2019 St. Louis/Minnesota 0.9M
02/23/2019 Pittsburgh/Philadelphia 1.9M
03/03/2019 Washington/NY Rangers 1.3M
03/24/2019 Philadelphia/Washington 0.7M
03/31/2019 NY Rangers/Philadelphia 0.8M
Average: 1.3M
NBCSN:
10/3/2018 Boston/Washington 633k
10/3/2018 Anaheim/San Jose 338k
10/4/2018 Nashville/NY Rangers 194k (non-exclusive)
10/4/2018 Philadelphia/Vegas 227k (non-exclusive)
10/9/2018 San Jose/Philadelphia 249k
10/10/2018 Vegas/Washington 543k
10/16/2018 Arizona/Minnesota 197k
10/17/2018 NY Rangers/Washington 329k
10/17/2018 Boston/Calgary 162k
10/19/2018 Minnesota/Dallas 196k
10/23/2018 San Jose/Nashville N/A
10/24/2018 Toronto/Winnipeg 167k
10/24/2018 Tampa Bay/Colorado 177k
10/30/2018 Vegas/Nashville 227k
11/01/2018 Winnipeg/Florida N/A
11/06/2018 Edmonton/Tampa Bay N/A
11/07/2018 Pittsburgh/Washington 642k
11/07/2018 Nashville/Colorado 222k
11/13/2018 Tampa Bay/Buffalo 243k
11/14/2018 St. Louis/Chicago 407k
11/14/2018 Anaheim/Vegas 230k
11/20/2018 Edmonton/San Jose N/A (non-exclusive)
11/21/2018 Philadelphia/Buffalo 290k (non-exclusive)
11/23/2018 Chicago/Tampa 160k (non-exclusive)
11/27/2018 Vegas/Chicago 189k (non-exclusive)
11/28/2018 St. Louis/Detroit 293k
11/28/2018 Pittsburgh/Colorado 281k (non-exclusive)
12/03/2018 Toronto/Buffalo 286k
12/05/2018 Edmonton/St. Louis 262k
12/05/2018 Chicago/Anaheim 125k (non-exclusive)
12/11/2018 Detroit/Washington 174k (non-exclusive)
12/12/2018 Pittsburgh/Chicago 519k
12/18/2018 Nashville/Chicago 140k (non-exclusive)
12/19/2018 Pittsburgh/Washington 697k
12/21/2018 Buffalo/Washington 278k (non-exclusive)
12/22/2018 Los Angeles/San Jose 192k
12/27/2018 Philadelphia/Tampa 248k
01/02/2019 Pittsburgh/NY Rangers 472k
01/02/2019 San Jose/Colorado 241k
01/03/2019 Chicago/NY Islanders 288k (non-exclusive)
01/06/2019 Chicago/Pittsburgh 474k
01/07/2019 Los Angeles/San Jose 109k
01/08/2019 Philadelphia/Washington 192k (non-exclusive)
01/09/2019 Nashville/Chicago 379k
01/10/2019 Winnipeg/Minnesota 245k
01/14/2019 Montreal/Boston 345k
01/15/2019 Los Angeles/Minnesota 207k
01/16/2019 Boston/Philadelphia 402k
01/16/2019 San Jose/Arizona 185k
01/17/2019 Chicago/NY Rangers 162k (non-exclusive)
01/21/2019 St.Louis/Los Angeles 133k (afternoon game)
01/22/2019 Detroit/Edmonton 214k
01/23/2019 Washington/Toronto 292k
01/23/2019 Nashville/Vegas 220k
01/28/2019 Winnipeg/Philadelphia 195k (non-exclusive)
01/29/2019 Philadelphia/NY Rangers 352k (non-exclusive)
01/30/2019 Tampa Bay/Pittsburgh 494k
02/06/2019 Boston/NY Rangers 428k
02/10/2019 Toronto/NY Rangers 304k
02/11/2019 Pittsburgh/Philadelphia 262k (non-exclusive)
02/12/2019 Chicago/Boston 158k (non-exclusive)
02/13/2019 Edmonton/Pittsburgh 393k
02/17/2019 Philadelphia/Detroit 421k
02/18/2019 Columbus/Tampa Bay 281k
02/18/2019 Boston/San Jose 184k (non-exclusive)
02/19/2019 Toronto/St. Louis 288k
02/20/2019 Chicago/Detroit 500k
02/20/2019 Boston/Vegas 312k
02/21/2019 Los Angeles/Nashville 157k
02/24/2019 St. Louis/Minnesota 477k
02/25/2019 Los Angeles/Tampa Bay 294k
02/26/2019 Buffalo/Philadelphia 259k (non-exclusive)
02/27/2019 Tampa Bay/NY Rangers 379k
02/27/2019 Chicago/Anaheim 223k (non-exclusive)
02/28/2019 Tampa Bay/Boston 509k
03/03/2019 Nashville/Minnesota 449k
03/05/2019 Minnesota/Nashville 310k
03/06/2019 Washington/Philadelphia 373k
03/06/2019 St.Louis/Anaheim 204k
03/07/2019 Columbus/Pittsburgh 229k (non-exclusive)
03/10/2019 Boston/Pittsburgh 715k
03/10/2019 Los Angeles/Anaheim 263k
03/11/2019 San Jose/Minnesota 344k
03/12/2019 Washington/Pittsburgh 272k (non-exclusive)
03/13/2019 Chicago/Toronto 371k
03/13/2019 New Jersey/Edmonton 159k
03/17/2019 Philadelphia/Pittsburgh 707k
03/17/2019 Edmonton/Vegas 269k
03/19/2019 Washington/New Jersey 135k (non-exclusive)
03/20/2019 Tampa Bay/Washington 451k
03/20/2019 Winnipeg/Anaheim 172k
03/24/2019 Colorado/Chicago 339k
03/25/2019 Nashville/Minnesota 288k
03/26/2019 Carolina/Washington 278k (non-exclusive)
03/27/2019 NY Rangers/Boston 457k
03/27/2019 Vegas/Colorado 332k
03/31/2019 Boston/Detroit 363k
04/01/2019 Colorado/St. Louis 365k
04/02/2019 Boston/Columbus 204k (non-exclusive)
04/03/2019 St. Louis/Chicago 352k
04/04/2019 Montreal/Washington 161k (non-exclusive)
Cable average: 304k
Next:
PLAYOFFS
Is this up or down vs. last season?
Coinneach
Registered User
Up. And with so many "NJ/Edmonton games" it is a small miracle.Is this up or down vs. last season?
Last edited:
46zone
Pass me the soft pretzels
It's pretty remarkable ratings had any growth considering Chicago, NYR, Philly, Detroit, LA, and Minnesota not being in contention.
SwaggySpungo
Registered User
- Oct 18, 2018
- 768
- 969
Up. And with so many "NJ/Edmonton games" it is a small miracle.
So ratings were up on both broadcast and cable?
Do we know by what percentage vs. last season?
Coinneach
Registered User
So ratings were up on both broadcast and cable?
Do we know by what percentage vs. last season?
Cable was up, broadcast I dont know.
We have to wait for official NBC press release.
NextBigThing
Registered User
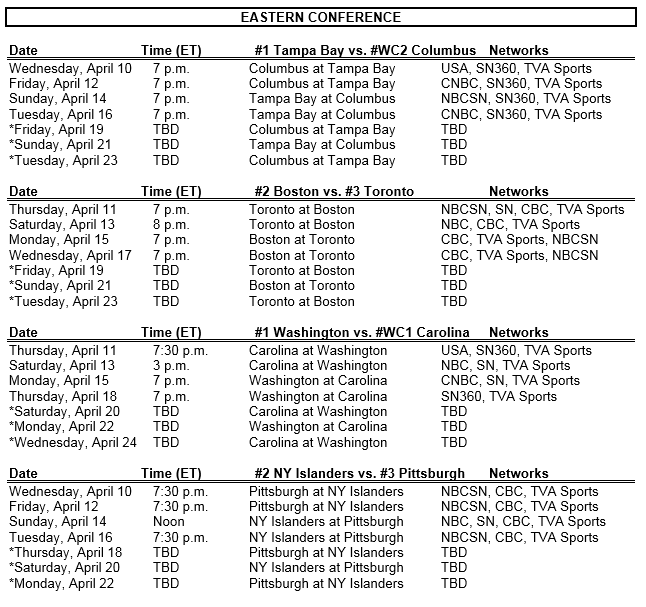
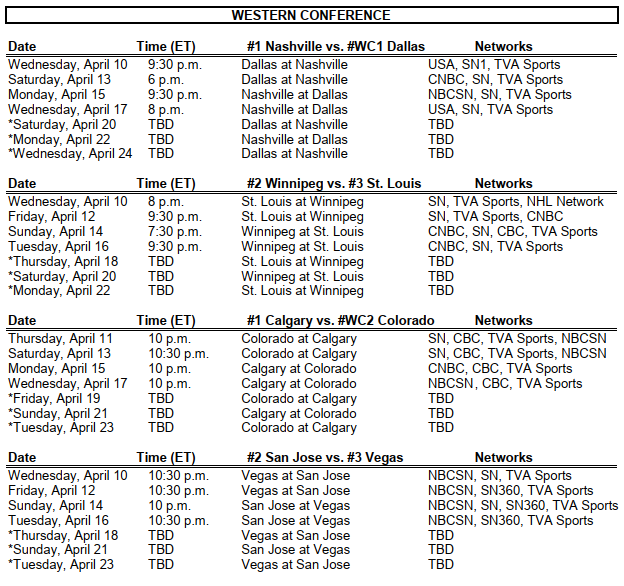
Here's my prediction on how the "draft" up in Canada will go:
CBC- BOS/TOR
CBC- CGY/COL
TSN- WPG/STL
CBC- NYI/PIT
TSN-
CBC-
TSN-
TSN-
The last 4 series don't really matter. The networks will just take whatever fills out doubleheaders easier.
CBC- BOS/TOR
CBC- CGY/COL
TSN- WPG/STL
CBC- NYI/PIT
TSN-
CBC-
TSN-
TSN-
The last 4 series don't really matter. The networks will just take whatever fills out doubleheaders easier.
Coinneach
Registered User
Too many canadiens teams, but Boston - Toronto and Vegas - San Jose could be ratings succes for NBC.
Too many canadiens teams, but Boston - Toronto and Vegas - San Jose could be ratings succes for NBC.
Islanders/Pittsburgh should do well Columbus/Tampa is promising as is Caps/Hurricanes
NBCSN numbers will be down in the first round as most fans will watch their local broadcasters.
SwaggySpungo
Registered User
- Oct 18, 2018
- 768
- 969
Too many canadiens teams, but Boston - Toronto and Vegas - San Jose could be ratings succes for NBC.
Huh?
Toronto is the only Canadian team in the entire Eastern conference.
And only Calgary and Winnipeg in the West.
eddygee
Registered User
- Mar 12, 2018
- 904
- 421
So ratings were up on both broadcast and cable?
Do we know by what percentage vs. last season?
NBCSN
2018-19 vs 2017-18
304k --- 302k
NBC
2018-2019 vs 2017-18
1.266M --- 1.29
NBC/NBCSN
2018-19 vs 2017-2018
413k ---- 417k
There are some wild cards here. One streaming average TAD Total Delivery could boost the overall average.
Two there are by my count 5 games that rated too low to have a TV aren't apart of the 304k and 413k Cable average. A month ago when NBC PR put out their numbers they were a little higher than the numbers we've accurately tracked on here. So since we didn't include those 5 games which would in effect lower the overall average either NBC didn't include those 5 games or the streaming numbers are really strong. The 5 games are below, regardless it will be interesting to see the numbers. This year will be the crucial year as this will be the last chance to improve fortunes for a big TV deal.
10/23/2018 San Jose/Nashville N/A
11/01/2018 Winnipeg/Florida N/A
11/06/2018 Edmonton/Tampa Bay N/A
11/20/2018 Edmonton/San Jose N/A
04/03/2019 Calgary/Anaheim/NA
Last edited:
NBC SPORTS’ 2018-19 NHL REGULAR-SEASON COVERAGE DELIVERS VIEWERSHIP INCREASES ACROSS ALL PLATFORMS
STAMFORD, Conn. – April 8, 2019 – NBC Sports’ coverage of the 2018-19 NHL regular season – which included a record 112 games as well as a record number of doubleheaders and games featuring Canadian and Western Conference teams – delivered viewership increases across all platforms, according to Nielsen. Combined viewership across NBC, NBCSN, NBCSports.com and the NBC Sports app averaged a Total Audience Delivery (TAD) of 424,000 viewers, up 2% vs. the 2017-18 regular-season (105 games, 417,000).

Providence is scoring higher as many in the Boston suburbs west and south of the city are electing to watch Channel 10 out of Providence instead of NBC's owned outlet in Boston that also calls itself Channel 10 but actually transmits on Channels 15.1, 8.1 and 60.2
STAMFORD, Conn. – April 8, 2019 – NBC Sports’ coverage of the 2018-19 NHL regular season – which included a record 112 games as well as a record number of doubleheaders and games featuring Canadian and Western Conference teams – delivered viewership increases across all platforms, according to Nielsen. Combined viewership across NBC, NBCSN, NBCSports.com and the NBC Sports app averaged a Total Audience Delivery (TAD) of 424,000 viewers, up 2% vs. the 2017-18 regular-season (105 games, 417,000).
Providence is scoring higher as many in the Boston suburbs west and south of the city are electing to watch Channel 10 out of Providence instead of NBC's owned outlet in Boston that also calls itself Channel 10 but actually transmits on Channels 15.1, 8.1 and 60.2
eddygee
Registered User
- Mar 12, 2018
- 904
- 421
NBC SPORTS’ 2018-19 NHL REGULAR-SEASON COVERAGE DELIVERS VIEWERSHIP INCREASES ACROSS ALL PLATFORMS
STAMFORD, Conn. – April 8, 2019 – NBC Sports’ coverage of the 2018-19 NHL regular season – which included a record 112 games as well as a record number of doubleheaders and games featuring Canadian and Western Conference teams – delivered viewership increases across all platforms, according to Nielsen. Combined viewership across NBC, NBCSN, NBCSports.com and the NBC Sports app averaged a Total Audience Delivery (TAD) of 424,000 viewers, up 2% vs. the 2017-18 regular-season (105 games, 417,000).
View attachment 210879
Providence is scoring higher as many in the Boston suburbs west and south of the city are electing to watch Channel 10 out of Providence instead of NBC's owned outlet in Boston that also calls itself Channel 10 but actually transmits on Channels 15.1, 8.1 and 60.2
2% ain't much but we'll take it. It's a big relief and can't be overstated how big it was to reverse the downward trend NHL ratings had been in for the last couple years. I'm anxious to see how that relates in the TV negotiations in the off season.
Last edited:
Coinneach
Registered User
NHL had solid regular season (it is great with so many Canadiens teams) but the TV revenue is in play-offs.
NBCSN
2018-19 vs 2017-18
313k vs 302k (UP 4%)
NBC
2018-2019 vs 2017-18
1.31M vs 1.29M (UP 2%)
NBC/NBCSN
2018-19 vs 2017-2018
424k vs 417k (UP 2%)
NBC SPORTS’ 2018-19 NHL REGULAR-SEASON COVERAGE DELIVERS VIEWERSHIP INCREASES ACROSS ALL PLATFORMS
NBCSN
2018-19 vs 2017-18
313k vs 302k (UP 4%)
NBC
2018-2019 vs 2017-18
1.31M vs 1.29M (UP 2%)
NBC/NBCSN
2018-19 vs 2017-2018
424k vs 417k (UP 2%)
NBC SPORTS’ 2018-19 NHL REGULAR-SEASON COVERAGE DELIVERS VIEWERSHIP INCREASES ACROSS ALL PLATFORMS
Last edited:
Here's my prediction on how the "draft" up in Canada will go:
CBC- BOS/TOR
CBC- CGY/COL
TSN- WPG/STL
CBC- NYI/PIT
TSN-
CBC-
TSN-
TSN-
The last 4 series don't really matter. The networks will just take whatever fills out doubleheaders easier.
TSN would love to be invited to the party but they have been banned from the playoffs since 2014.
eddygee
Registered User
- Mar 12, 2018
- 904
- 421
NHL had solid regular season (it is great with so many Canadiens teams) but the TV revenue is in play-offs.
NBCSN
2018-19 vs 2017-18
313k vs 302k (UP 4%)
NBC
2018-2019 vs 2017-18
1.31M vs 1.29M (UP 2%)
NBC/NBCSN
2018-19 vs 2017-2018
424k vs 417k (UP 2%)
NBC SPORTS’ 2018-19 NHL REGULAR-SEASON COVERAGE DELIVERS VIEWERSHIP INCREASES ACROSS ALL PLATFORMS
Playoff numbers will be crucial then hoping for HUGE Playoff numbers and a 2 peat for Ovi and the boys. We still are the kings, gotta take it from us.
Coinneach
Registered User
LadyStanley
Registered User
Coinneach
Registered User
- Status
- Not open for further replies.
Ad
Upcoming events
-
 Pelicans Lahti @ Tappara Tampere - Tappara leads series 2-0Wagers: 2Staked: $15,126.00Event closes
- Updated:
-

-

-
-