What NHL teams have strong/weak drafting

BinCookin

Registered User
Feb 15, 2012
6,160
1,377
London, ON
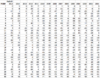
btw can you see my data sheet yet?

If not I will try to explain the redrafts:

you may be surprised at how few good players there actually are in any one year.

the difference between 33 and 27 is quite large:

33=Dzingel; 26/27/28 are Shaw/Pageau/Lowry
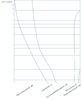
And the points move exponentially different so where 33/27 seems like a similar number, they are much different on the score chart: 400 vs 285

thus my redraft positions do make a big difference in the scores.


the new score thing was just a 2nd (i think inferior value chart).
 

TheOtherOne

Registered User
Jan 2, 2010
8,273
5,266
@BinCookin if you want more work to do I think it'd be interesting to map the confidence values for each position with your data.

i.e. if I pick at 17, the player has an X% chance to redraft within +/- 2 positions, a W% chance to redraft higher, a V% chance to be a total steal... or Y%, Z% to be a bust.

Something to that effect.

Should be reasonably straightforward depending how your spreadsheet is set up.
 

BinCookin

Registered User
Feb 15, 2012
6,160
1,377
London, ON
@BinCookin if you want more work to do I think it'd be interesting to map the confidence values for each position with your data.

i.e. if I pick at 17, the player has an X% chance to redraft within +/- 2 positions, a W% chance to redraft higher, a V% chance to be a total steal... or Y%, Z% to be a bust.

Something to that effect.

Should be reasonably straightforward depending how your spreadsheet is set up.

I would expect those results to simply match the value chart in the first place. I mean even if it turned out Pick 9 was more solid than pick 7... what would we learn from those numbers? (luck) I mean we know the earlier the pick, the better the odds of a good player.
 
Last edited:

TheOtherOne

Registered User
Jan 2, 2010
8,273
5,266
I'm talking about a chart like this. Overall confidence, on average, of a given pick. What are the chances that my #17 pick is going to be a steal or a bust?

Does that make sense?

If you have no interest, don't waste your time. I just personally think it'd be an interesting chart to look at.

To clarify, it's just one chart, that would encompass the average of every team for every year.
So the top line in the chart shows that the first overall pick, on average, gets redrafted as a massive bust 2% of the time, a 3+ position drop (loss) 28% of the time, and redrafted roughly the same (predicted correctly) 70% of the time.
I pulled these numbers out of my ass. What I'm looking for is the actual numbers filled in based on your data.
 

Attachments

  • Picture1.jpg
    Picture1.jpg
    110.9 KB · Views: 6

PelagicJoe

Registered User
Mar 20, 2012
2,147
573
St. Louis, MO
I still say the following as of the past 5 to 10 years.

Good: Nashville, Tampa, St. Louis, Toronto, Washington

Bad: Us, Edmonton, (How many top ten picks did they have over the years with only McDavid, RNH, and Draisaitl [was he top ten?] to show for it?) Maybe Vancouver. The usual bottom feeders like Florida, Montreal, Arizona can probably be put in the discussion too.
 

Henkka

Registered User
Jan 31, 2004
31,192
12,183
Tampere, Finland
I still say the following as of the past 5 to 10 years.

Good: Nashville, Tampa, St. Louis, Toronto, Washington

Bad: Us, Edmonton, (How many top ten picks did they have over the years with only McDavid, RNH, and Draisaitl [was he top ten?] to show for it?) Maybe Vancouver. The usual bottom feeders like Florida, Montreal, Arizona can probably be put in the discussion too.

Interesting mutual feeling.

From past 5 to 10 years we are pretty much on the Top5 in here: Best Drafting Teams in the NHL

We were 8th best from 2008 to 2011. Then 3rd best from 2012 to 2016.

This averages on the ~Top5 from that era.
 
Last edited:

Ad

Upcoming events

Ad

Ad