You do realize that the GF% vs Points per game (2016/17) chart would have a R squared of:
Here's all the actual R squared stats from last season in the NHL:
R-
squared is a statistical measure of how close the data are to the fitted regression line. It is also known as the coefficient of determination, or the coefficient of multiple determination for multiple regression. ... 100% indicates that the model explains all the variability of the response data around its mean.
| CF/60 | CA/60 | CF% | FF/60 | FA/60 | FF% | SF/60 | SA/60 | SF% | GF/60 | GA/60 | GF% | SCF/60 | SCA/60 | SCF% | SCGF/60 | SCGA/60 | SCGF% | SCSH% | SCSV% | HDCF/60 | HDCA/60 | HDCF% | HDGF/60 | HDGA/60 | HDGF% | HDSH% | HDSV% | SH% | SV% | PDO |
[TBODY]
[/TBODY]
| 0.1773 | 0.0093 | 0.118 | 0.159 | 0.1041 | 0.195 | 0.261 | 0.125 | 0.282 | 0.7238 | 0.672 | 0.948 | 0.3762 | 0.00746 | 0.283 | 0.577972 | 0.62597 | 0.88799 | 0.32780 | 0.52157 | 0.266628 | 0.001182 | 0.233705 | 0.407168 | 0.446546 | 0.645152 | 0.174067 | 0.346533 | 0.63 | 0.50 | 0.788 |
[TBODY]
[/TBODY]
So in order these were the "best" correlative stats last season with regards to pts/game:
GF% .949
Scoring Chances GF% .888
PDO .789
GF/60 .724
GA/60 .673
High Danger GF% .645
SH% .639
Scoring Chances GA/60 .626
Scoring Chances GF/60 .578
Scoring Chances SV % .522
SV% .506
High Danger GA/60 .447
High Danger GF/60 .407
Scoring Chances F/60 .376
High Danger SV% .347
Scoring Chances SH% .328
Scoring Chances% .284
Shots F% .283
High Danger Chances F/60 .267
Shots F/60 .262
High Danger Chances F% .234
Fenwick F% .196
Corsi F/60 .177
High Danger SH% .174
Fenwick F/60 .160
Shots A/60 .125
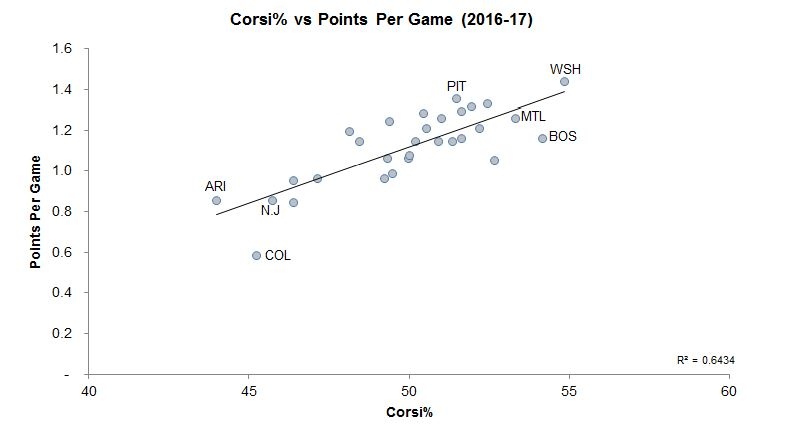
Corsi F% .118
Fenwick A/60 .104
Corsi A/60 .009
Scoring Chances A/60 .007
High Danger Chances A/60 .001
So essentially it's obvious to see that stats based around reality (goals for and against on the scoreboard) are the most indicative of a teams success.
The ability to actually score goals and keep them out is very highly correlated to pts... common sense really.
Corsi stats have very low correlation to actual scoreboard results... which should be easily deduced from the number of times a team can out-corsi another team yet still loses the game... ie the Oilers this season for a prime example right under our noses.