Moneypuck

SnowblindNYR

HFBoards Sponsor
Sponsor
Nov 16, 2011
52,104
30,689
Brooklyn, NY
Does anyone know how they determine their probabilities of winning rounds? I'd love to know how the team that's currently in the driver's seat for #2 in the east with a possibility of getting #1 (two games left against the Canes as well), has worse chance than any team in the east of making it to the second round and a worse chance than any team in the playoff picture except for Dallas and Vegas (by like 1-2%) with neither Dallas nor Vegas even being close to a lock to even make the playoffs. Vegas has a 50.5% chance of even making the playoffs according to their model.

Do they use advanced stats or something? That's the only way I can see those odds be as low as they are since the Rangers haven't been great in that department. And even then, since the deadline they've had some of the best advanced stats in the league (albeit against a soft schedule).
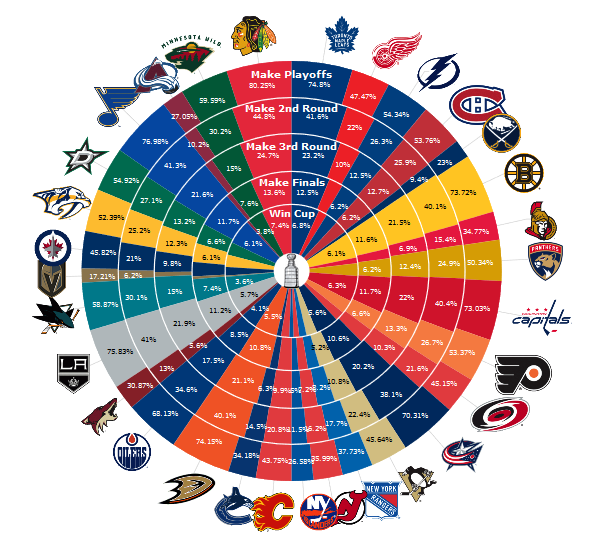
 

SnowblindNYR

HFBoards Sponsor
Sponsor
Nov 16, 2011
52,104
30,689
Brooklyn, NY
The variables used are itemized here:

Thanks, I really don't trust fancy stats to determine the cup winner. Also, there's one fatal flaw, we have a completely different team post-deadline. We've been top 5 probably in those stats since then. Considering we added 3 players (4 when Braun plays) it's a significant flaw in their methodology.
 

Took a pill in Sbisa

2showToffoliIwascool
Apr 23, 2004
16,320
7,074
Australia
Anecdotally, Frank Seravalli recently mentioned in his podcast that a friend of his found that the most relevant single analytic to predict playoff success is score-adjusted Fenwick from the final 2 months of the regular season.

Does anyone happen to know where to find this information? I know Money Puck offers the stat for the entire season, but not for a specific time period.
 

Mickey Marner

Registered User
Jul 9, 2014
19,599
21,314
Dystopia
Anecdotally, Frank Seravalli recently mentioned in his podcast that a friend of his found that the most relevant single analytic to predict playoff success is score-adjusted Fenwick from the final 2 months of the regular season.

Does anyone happen to know where to find this information? I know Money Puck offers the stat for the entire season, but not for a specific time period.
I only know of full season increments. However, naturalstattrick allows you to select a date range and sort by 'within 1', which is tied or leading/trailing by 1 goal. Results wouldn't be the same, but they would be similar.
 
  • Like
Reactions: DatsyukToZetterberg

oPlaiD

Registered User
Dec 3, 2007
833
623
As in the explanation linked above, Moneypuck did try multiple different weighs of weighting recent games, including only using the most recent 20-30 games or weighting more recent games exponentially, and decided on the following:

"Ultimately, using full season to date data with a linear decay of game importance showed to have the most predictive power."​

So the most recent games are weighted more heavily. If the NYR continue performing at a higher level that will show more and more as the season creeps along.

As a Blues fan, I feel your pain and hope that the advanced stats somehow aren't accounting for all the on-ice magic happening with the team. But... yeah...
 

SnowblindNYR

HFBoards Sponsor
Sponsor
Nov 16, 2011
52,104
30,689
Brooklyn, NY
As in the explanation linked above, Moneypuck did try multiple different weighs of weighting recent games, including only using the most recent 20-30 games or weighting more recent games exponentially, and decided on the following:

"Ultimately, using full season to date data with a linear decay of game importance showed to have the most predictive power."​

So the most recent games are weighted more heavily. If the NYR continue performing at a higher level that will show more and more as the season creeps along.

As a Blues fan, I feel your pain and hope that the advanced stats somehow aren't accounting for all the on-ice magic happening with the team. But... yeah...

I don't know why including October games when the roster was completely different would show more predictive power. I understand post-trade deadline is a small sample size but it's also more relevant than pre-trade deadline.
 

Hockey Outsider

Registered User
Jan 16, 2005
9,163
14,490
I don't know why including October games when the roster was completely different would show more predictive power. I understand post-trade deadline is a small sample size but it's also more relevant than pre-trade deadline.

I suspect that's the trade-off. The post-trade deadline roster would be a better reflection of the team's ability, but the sample size would be very small. Plus, most of the time, there aren't major changes in a team's roster during the course of a season. I think the benefit of the larger sample size (looking at the entire season) more than offsets the fact that it's potentially less representative in cases where there are big roster changes during the season.
 

morehockeystats

Unusual hockey stats
Dec 13, 2016
617
296
Columbus
morehockeystats.com
As in the explanation linked above, Moneypuck did try multiple different weighs of weighting recent games, including only using the most recent 20-30 games or weighting more recent games exponentially, and decided on the following:

"Ultimately, using full season to date data with a linear decay of game importance showed to have the most predictive power."​

So the most recent games are weighted more heavily. If the NYR continue performing at a higher level that will show more and more as the season creeps along.

As a Blues fan, I feel your pain and hope that the advanced stats somehow aren't accounting for all the on-ice magic happening with the team. But... yeah...
Decay also refers to the final games that have little or no placement importance.
 

Ad

Upcoming events

Ad

Ad